
Fig. 6. High level of fatty acid oxidation enhances the phosphorylation of STAT6.
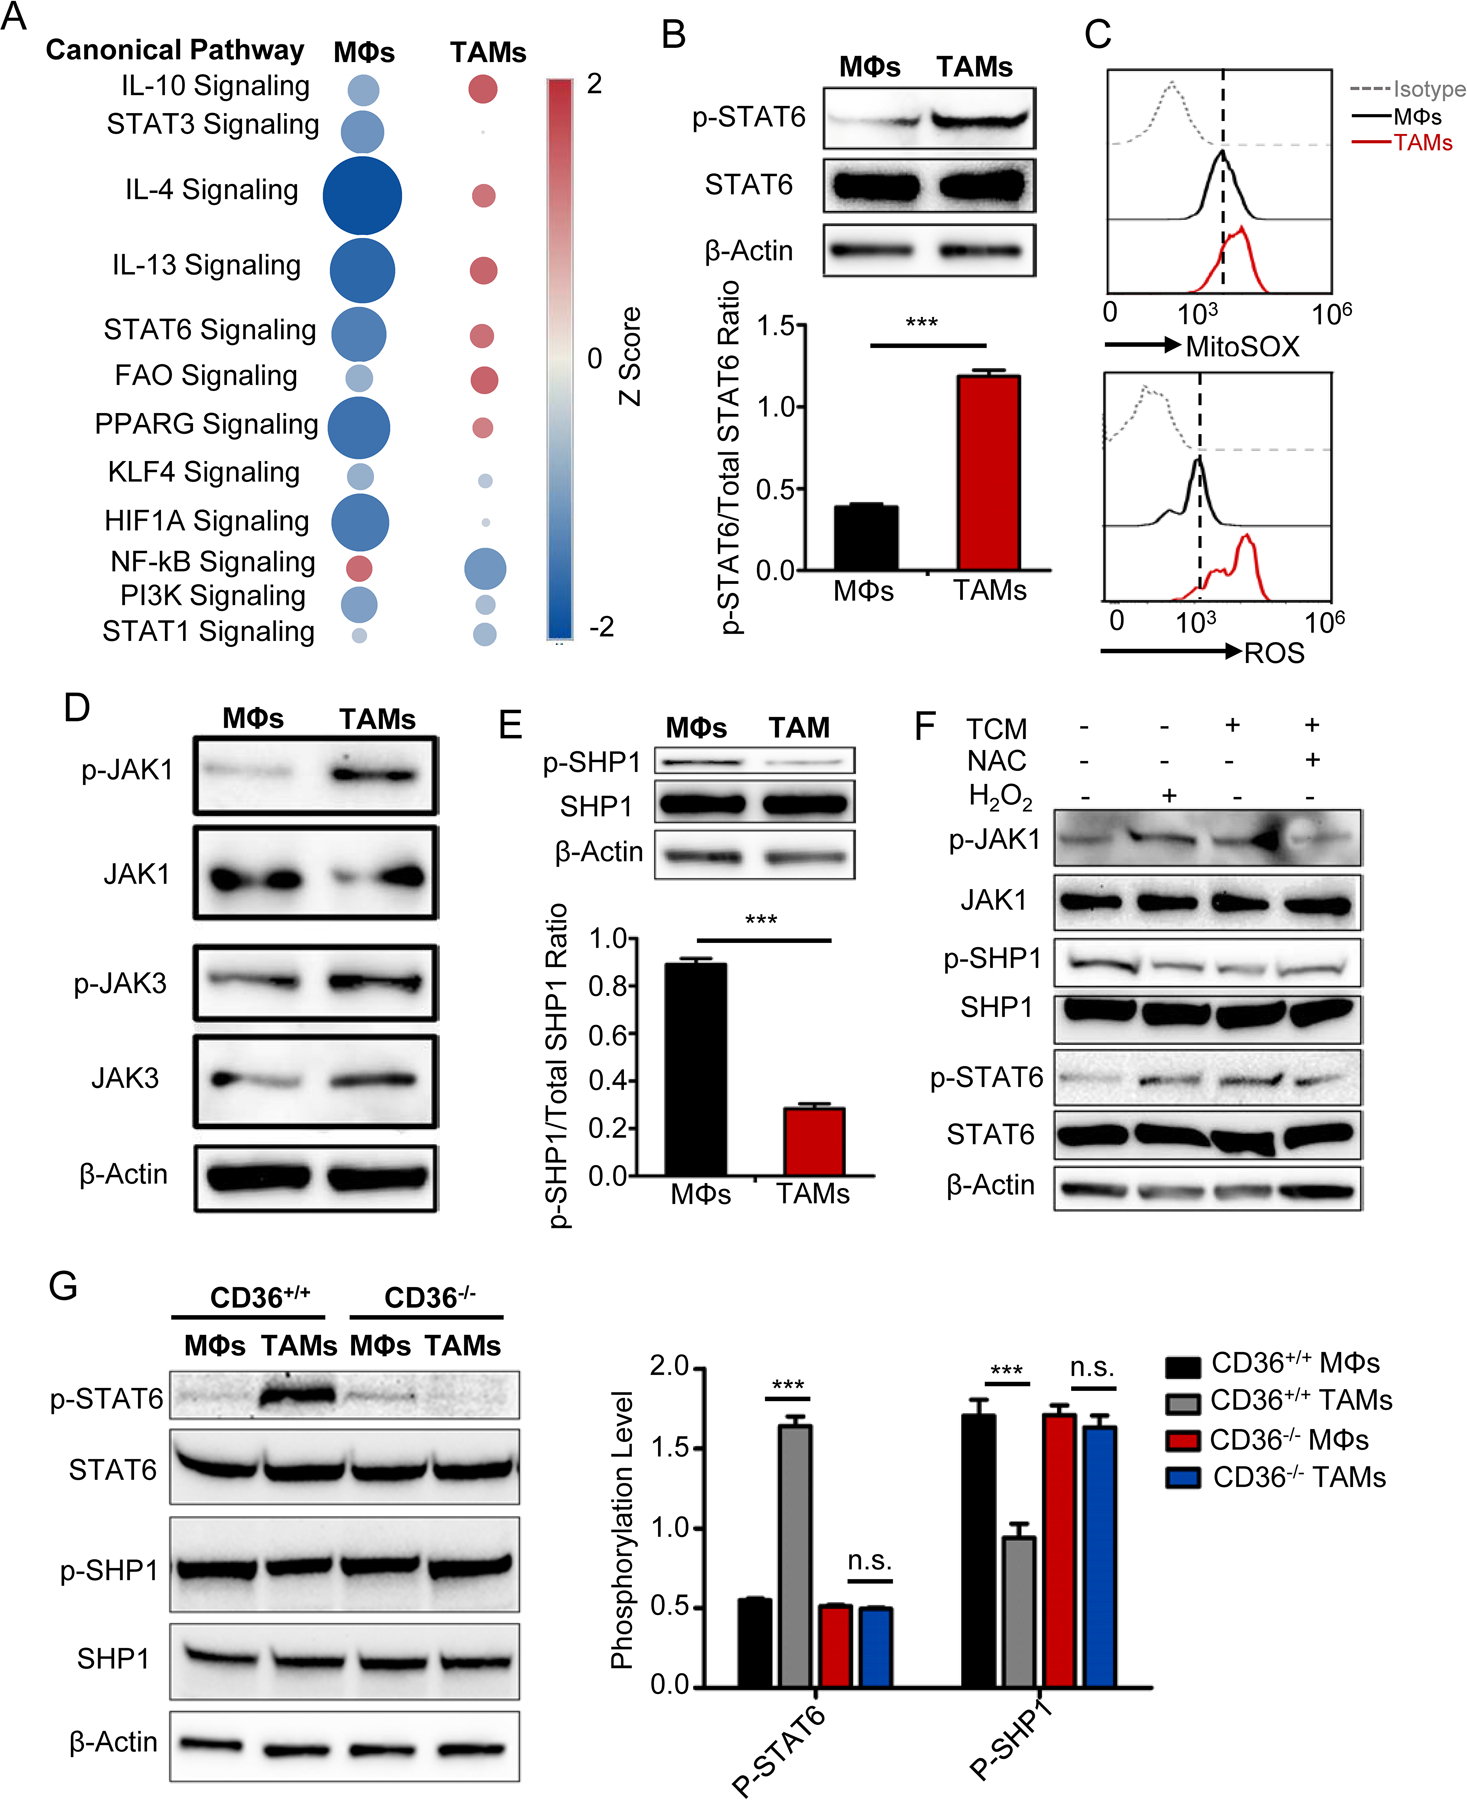
A, IPA analysis of canonical signaling pathways in control MΦs and TAMs. The circle surface area is proportional to −log (P-value) and the color intensity of circles indicates the Z score.
B, Representative western blots (upper) of 3 independent experiments and statistic result (lower) showing STAT6 phosphorylation in control MΦs and TAMs. Statistical significance was determined by two-tailed Student’s t test between indicated groups. ***, P < 0.001.
C, Representative histograms showing the levels of superoxide determined by Mitosox Red (upper) and cellular ROS by DCFDA (lower) in control MΦs and TAMs.
D, Representative immunoblots of JAK1 and JAK3 phosphorylation in control MΦs and TAMs.
E, Representative immunoblots (lower) and quantitative result (upper) of the SHP1 phosphorylation in control MΦs and TAMs. Statistical significance was determined by two-tailed Student’s t test between indicated groups. ***, P < 0.001.
F, immunoblots of the phosphorylated and total JAK1, STAT6, and SHP1 in MΦs with indicated treatment.
G, Western blots of STAT6 and SHP1 phosphorylation in control MΦs and TAMs from CD36 WT and KO mice. Bar graph showing means ± SEM of 3 independent experiments. Statistical significance was determined by two-tailed Student’s t test between indicated groups. ***, P < 0.001, n.s., not significant.