
Fig. 7. Effect of fatty acid oxidation inhibition on protumor function of TAMs.
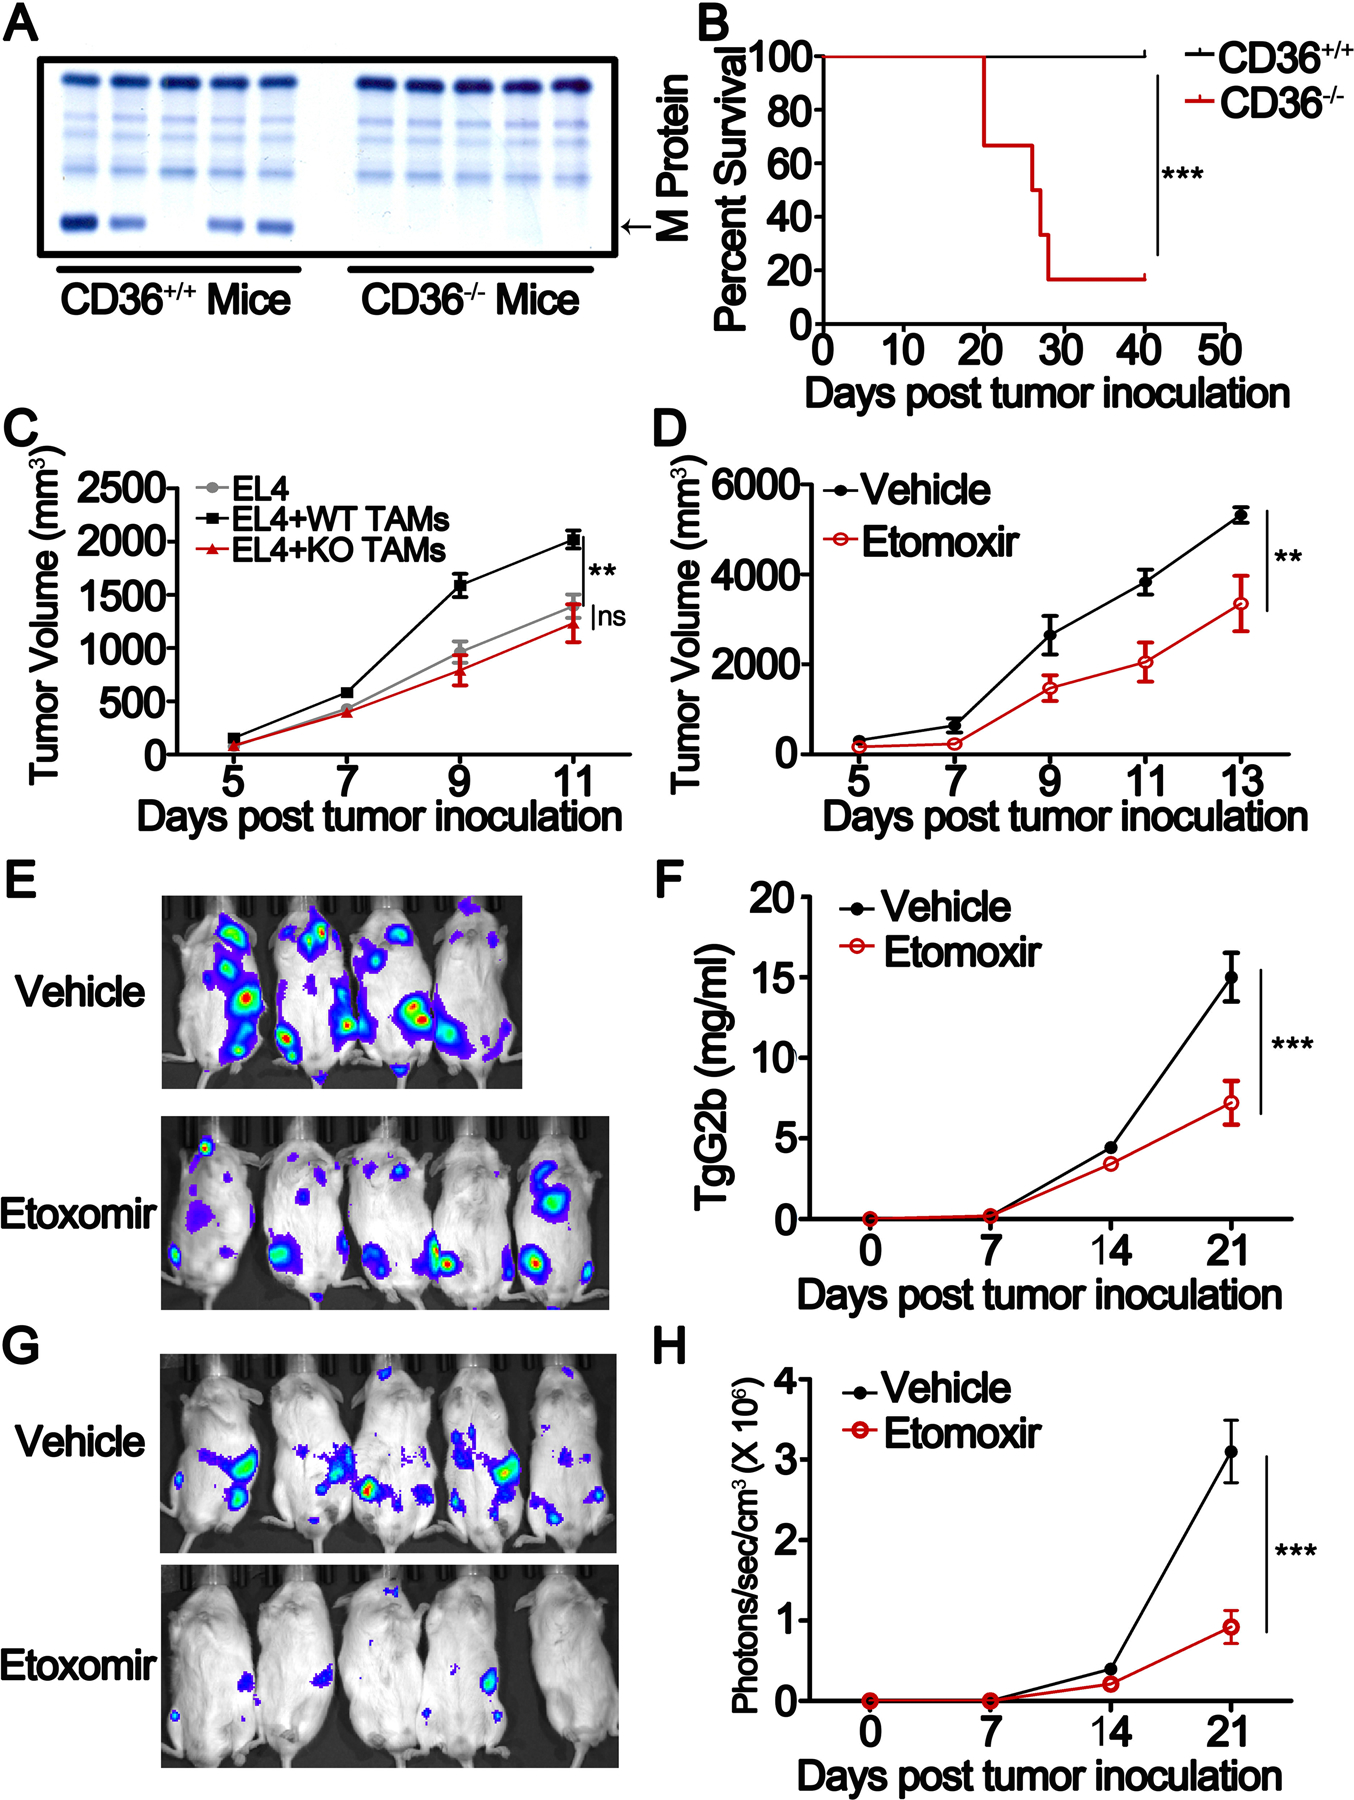
A, SPEP was performed on a representative Vk*MYC-bearing CD36 WT and KO mice. Arrows indicate M protein in Vk*MYC-bearing mice.
B, Survival curves of CD36 WT and KO mice bearing Vk*MYC myeloma cells. The results were analyzed by Log-rank (Mantel-Cox) test (**, P < 0.01).
C, EL4 lymphoma cells were mixed with or without CD36 WT or KO TAMs at a ratio of 5:1, and then injected subcutaneously into C57BL/6J mice. Tumor growth was monitored for 7 days. Results of tumor volumes are shown as means ± SEM. (* P < 0.05)
D, EL4-bearing NSG mice were treated with 50 mg/kg etomoxir intraperitoneally every two days after tumor injection. Tumor growth was followed for 9 days. Results of tumor volumes were shown as means ± SEM. (* P < 0.05)
E, Bioluminescent images of 5TGM1-luc myeloma cell-bearing NSG mice treated with 50 mg/kg etomoxir or vehicle on day 21.
F, Tumor burden measured as serum concentration of IgG2b in 5TGM1-bearing mice treated with etomoxir or vehicle. Results are shown as means ± SEM. **, P < 0.01.
G-H, Bioluminescent images (G) and statistic results of bioluminescent signals (H) of human MM.1S-luc cell-bearing NSG mice on day 21. Results are presented as means ± SEM. **, P < 0.01.