
Figure 1.
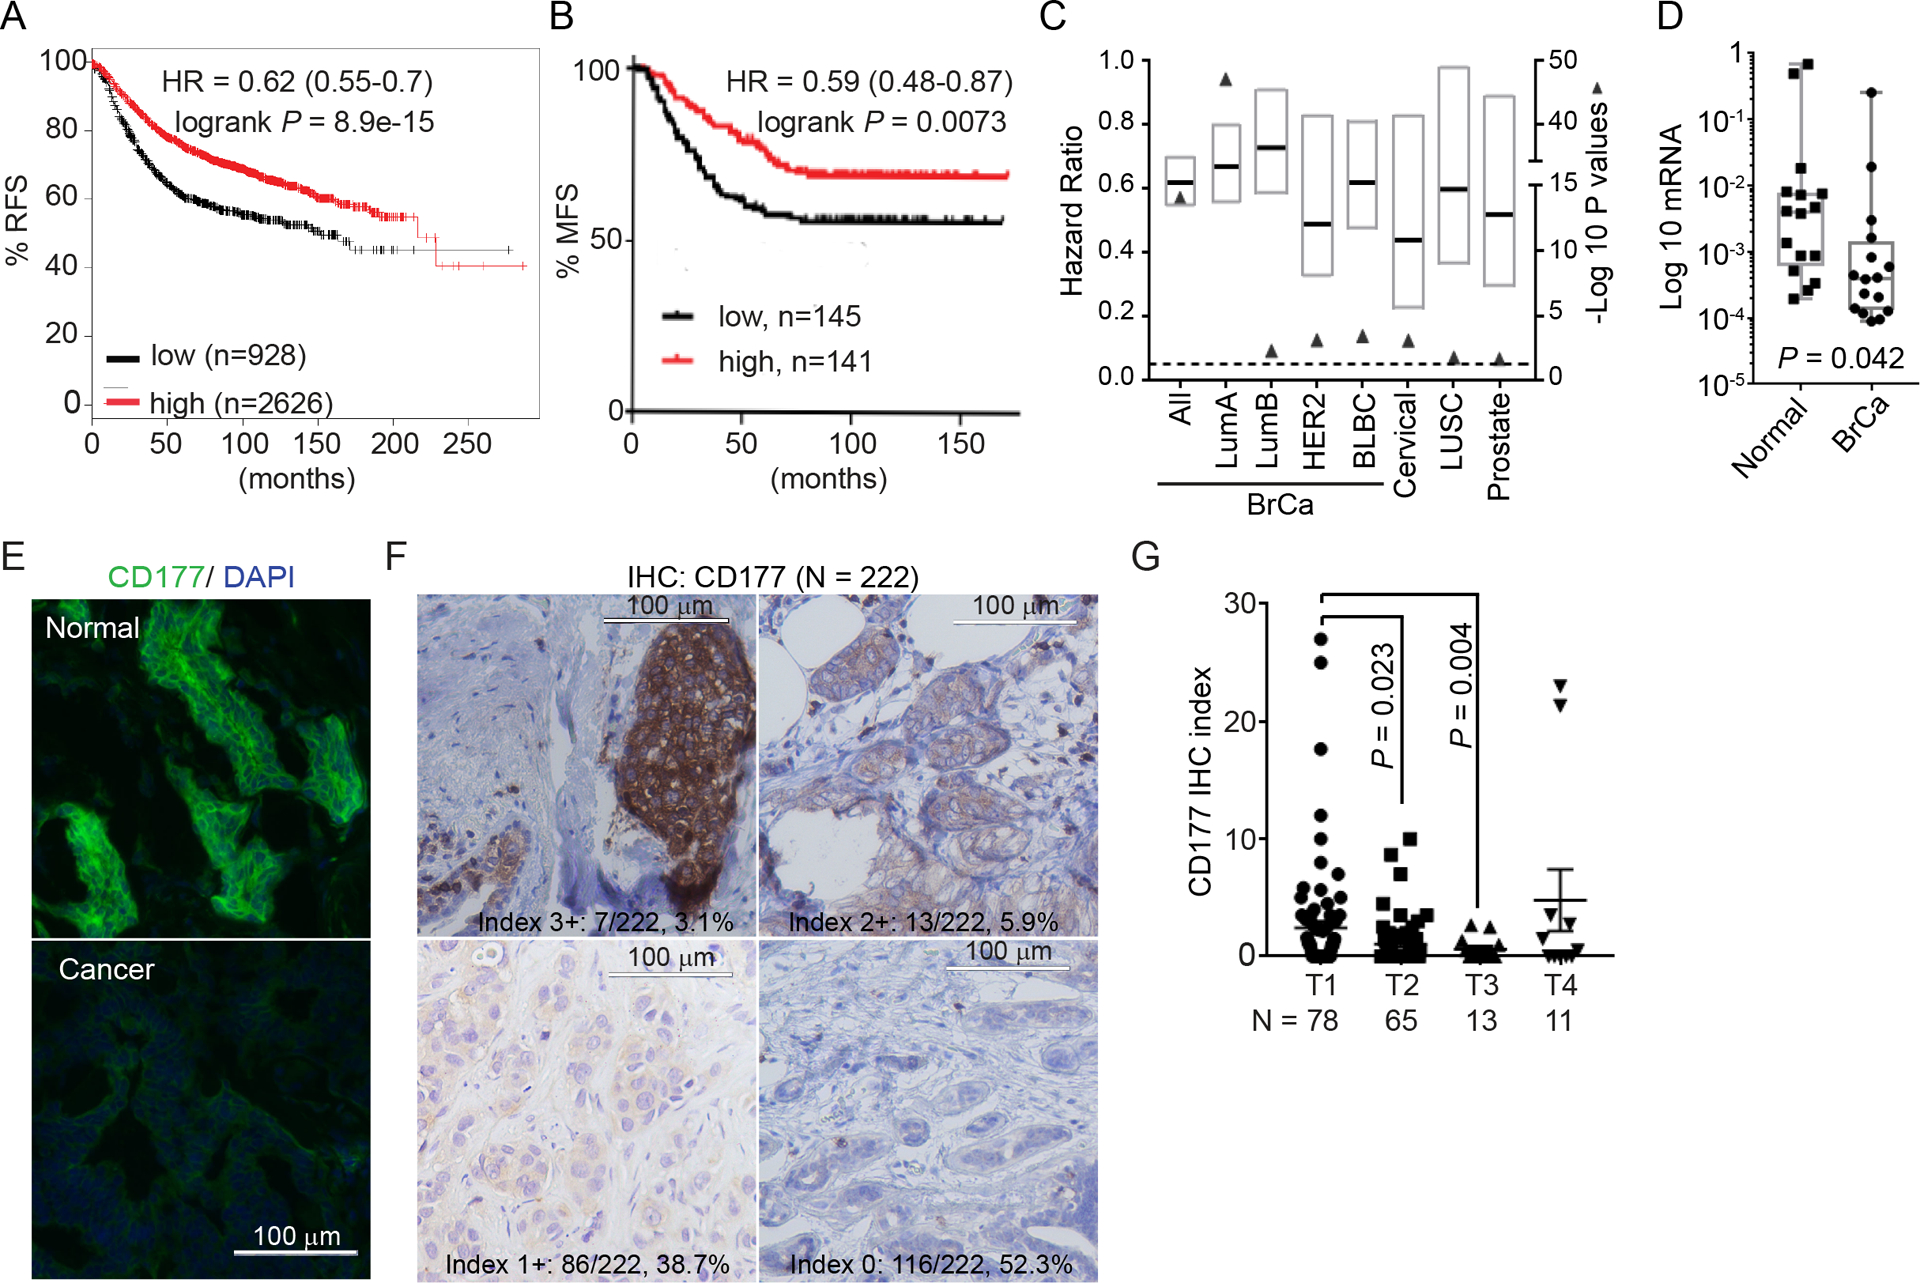
CD177 is commonly lost in invasive cancer and positively correlated with survival.
(A) Correlation between CD177 expression and relapse-free survival (RFS) in all breast cancer samples using an online KMPlot software including a total of 3554 breast cancer specimens.
(B) Correlation between CD177 expression and metastasis-free survival (MFS) in breast cancer among patient populations included in GSE2034 dataset (n=286). Logrank test was done to determine significance.
(C) Correlation between CD177 expression and RFS (breast cancer, BrCa; Lung squamous cell carcinoma, LUSC and prostate cancer), and overall survival (OS, Cervical cancer). BrCa data was generated using KMPlot software with samples separated by intrinsic subtypes (Luminal A, LumA; Luminal B, LumB; HER2+; basal-like breast cancer, BLBC). Cervical, LUSC and prostate data are from TCGA Illumina HiSeq level 3 data. Graph represents the hazard ratio (black bar) and range (box) with the −Log 10 Logrank P value (closed triangle). Dashed line is −Log10(0.05). N numbers for each group is presented in Table S2.
(D) CD177 log 10 mRNA level in breast cancer and paired normal tissue. n = 16, paired t test.
(E) Representative immunofluorescent staining for CD177 in human breast cancer specimen and paired normal tissue (n = 6 pairs, also Figure S2A).
(F) Representative IHC staining for CD177 of a tissue microarray of 222 human breast cancer samples. Samples were scored using index of 0–3+ bases on the intensity of CD177 staining and percentage of positivity. The intensity scores and number/percentages are indicated.
(G) CD177 IHC index for samples from F separated by tumor stage. IHC index was calculated by the following formula: Intensity index × Percentage × 10. One-way ANOVA was used to determine significance with adjusted P values indicated. Only samples with traceable tumor stage information were shown (n = 167).
Also see Supplementary Table S1–S3 and Figure S1–2.