
Figure 7. Resections for PDAC demonstrate differential expression of DUOX1 and DUOX2.
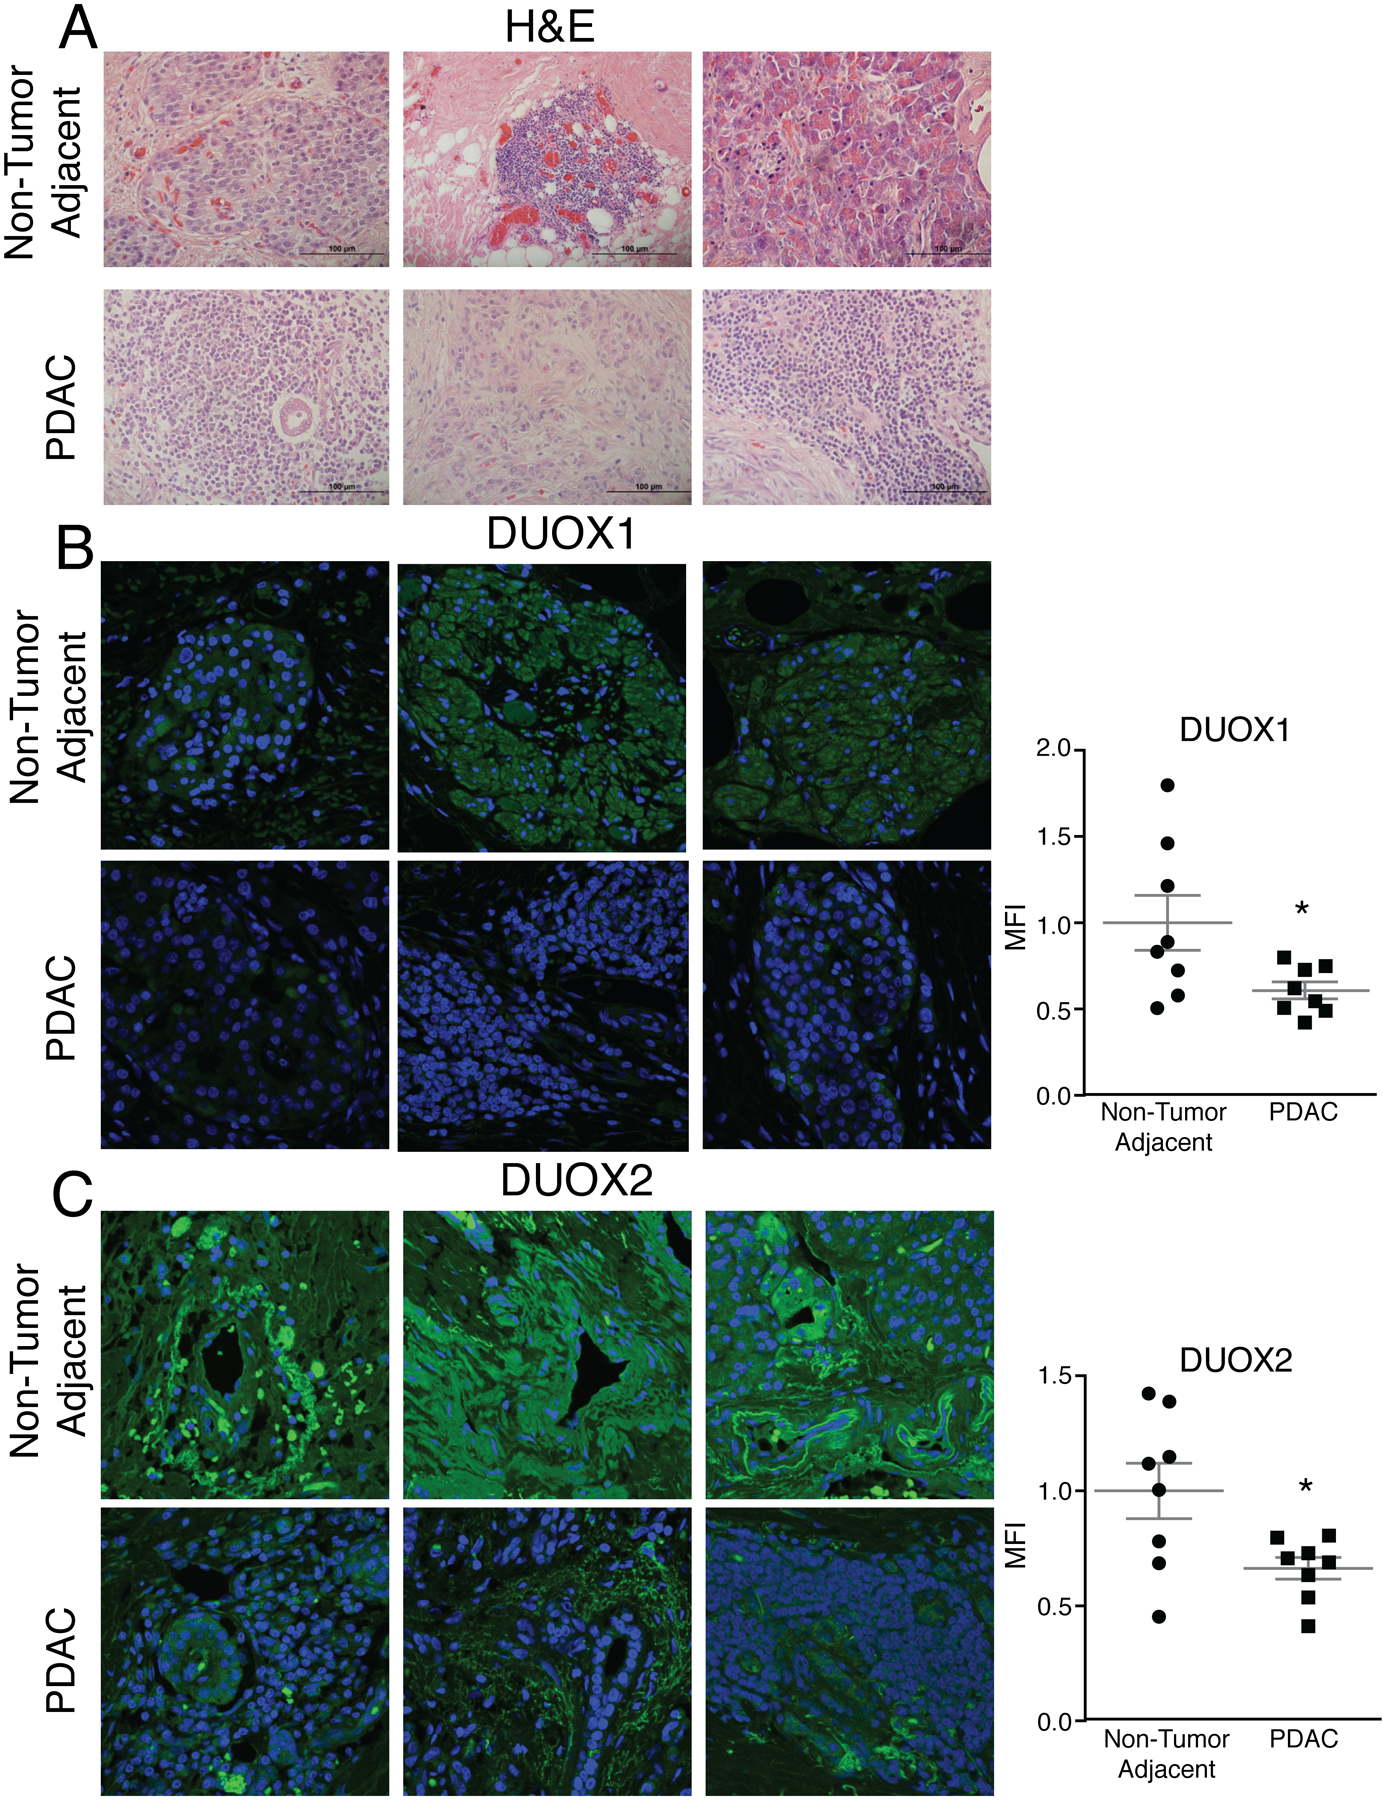
A. Hematoxylin and eosin staining performed on matched normal adjacent pancreas and PDAC from pancreaticoduodenectomy specimens demonstrated changes in morphology between normal adjacent and PDAC. Representative images shown.
B-C. DUOX1 and DUOX2 immunofluorescence staining was performed on non-tumor adjacent pancreas and PDAC in matched patient samples. Samples were visualized using a Zeiss Confocal Microscope 40x oil objective. Results show decreased DUOX1 and DUOX2 fluorescence in PDAC and increased DUOX1 and DUOX2 fluorescence in normal adjacent pancreas. Green staining is DUOX1/DUOX2 and blue staining is for nuclear Toppiosmerase-3. Representative images shown along with quantification demonstrating normalized mean fluorescence intensity (MFI) (Means ± SEM, n = 8, *p < 0.05 vs. adjacent normal, 2-tailed student’s t-test).