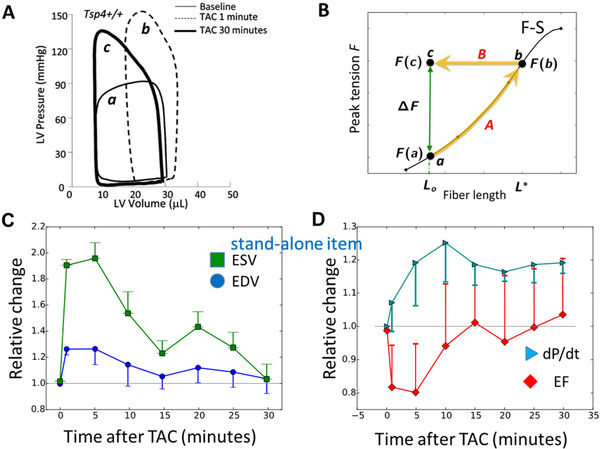
Figure 6: Frank-Starling law and Anrep effect.
A. Pressure-volume (P-V) loops before TAC (light black), 1 min after TAC (dashed curve), and 30 min after TAC (heavy black). From Cingolani et al. (Cingolani et al., 2011). B. Black curve shows the relationship between fiber length and force generated by Frank-Starling (F-S) mechanism. Lss is the steady state fiber length after the chamber volume has decreased due to stress-stimulated contractility (SSC) increase. ΔF (green arrow) is the force SSC needs to generate. F-S curve redrawn from Allen and Kurihara (Allen & Kurihara, 1982). C, D: Time evolution of left ventricular (LV) hemodynamic parameters following transaortic constriction (TAC). Values are normalized to initial values, when TAC imposed. EDV, end-diastolic volume; ESV, end-systolic volume; EF, ejection fraction; dP/dt, maximum rate of LV pressure change. Data redrawn from Cingolani et al. (2011).

