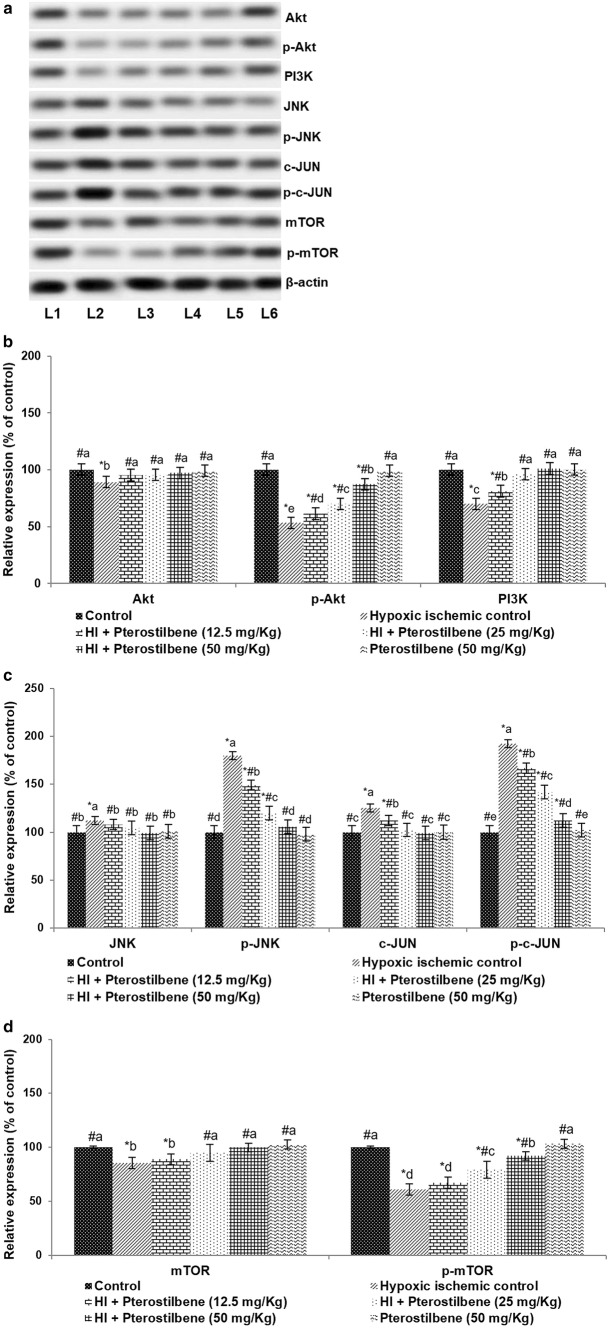
Fig. 7.
Pterostilbene up-regulated Akt activation following HI. a Representative immunoblot, b, c Relative expressions of proteins. Values are represented as mean ± SD, n = 6; P < 0.05 as determined by one-way ANOVA followed by DMRT analysis. *P < 0.05 vs. control; #P < 0.05 vs. HI control; a–e represents mean values from different experimental groups that differ from each other at P < 0.05. L1-Control; L2-Hypoxic Ischemic Control; L3-HI + Pterostilbene (12.5 mg/Kg); L4-HI + Pterostilbene (25 mg/Kg); L5-HI + Pterostilbene (50 mg/Kg); L6-Pterostilbene (50 mg/Kg)

