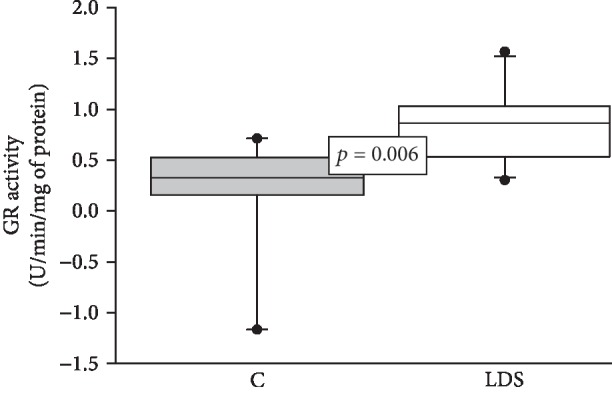
Figure 3.

Average activity of GR in LDS patients (n = 10) and C subjects (n = 9). Values are expressed as the median and Min–Max range. Abbreviations: LDS = Loeys-Dietz syndrome; C = control subjects.

Average activity of GR in LDS patients (n = 10) and C subjects (n = 9). Values are expressed as the median and Min–Max range. Abbreviations: LDS = Loeys-Dietz syndrome; C = control subjects.