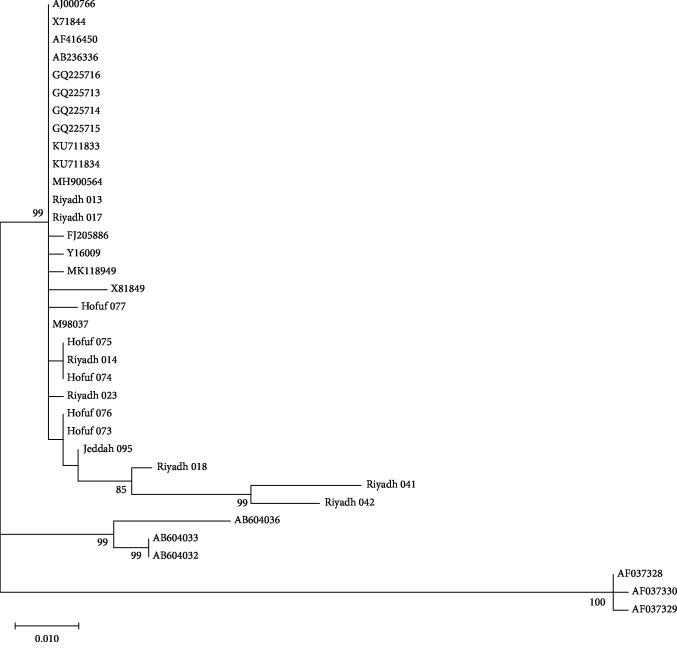
Figure 5.
Maximum likelihood phylogenetic tree showing the relationship of the epsilon toxin-producing genes from 13 sequences reported from C. perfringens isolates in the present study with related sequences from the GenBank. The tree is drawn to scale, with branch lengths measured in the number of substitutions per site. Only significant bootstrap values are shown. This analysis involved 35 nucleotide sequences. There was a total of 438 positions in the final dataset. Evolutionary analyses were performed in MEGA X.

