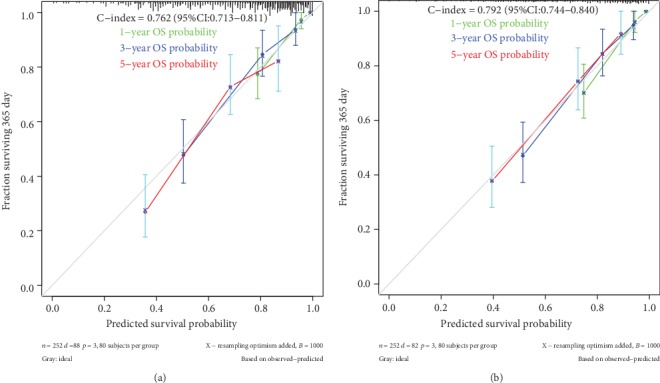
Figure 6.

Calibration curves for predicting 1-, 3- and 5-year overall survival (OS) in the development (a) and validation cohorts (b). Bootstrap-predicted survival is plotted on the x-axis, and actual outcome is located on the y-axis. Vertical bars indicate 95% CIs derived from Kaplan-Meier analysis. Gray lines along the 1-slope diagonal line through the origin point denote an excellent calibration model.
