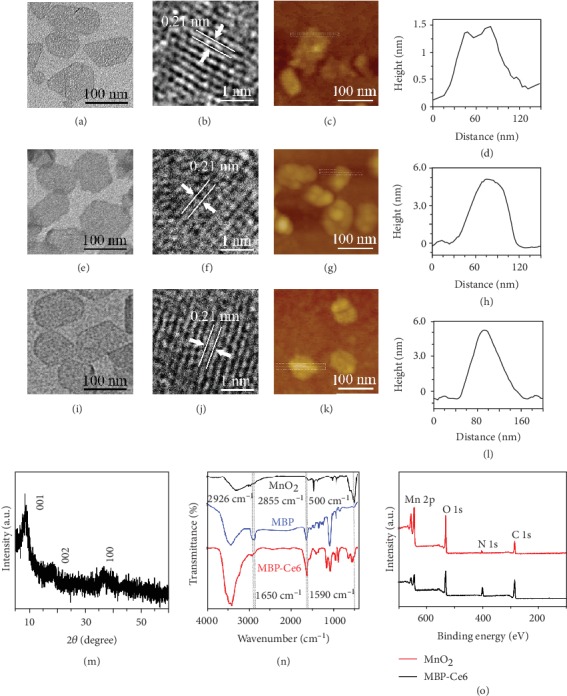
Figure 1.

Characterization of MnO2 NSs, MBP NSs, and MBP-Ce6 NSs. (a) TEM image, (b) HRTEM image, (c) AFM image, and (d) height profile of MnO2 NSs. (e) TEM image, (f) HRTEM image, (g) AFM image, and (h) height profile of MBP NSs. (i) TEM image, (j) HRTEM image, (k) AFM image, and (l) height profile of MBP-Ce6 NSs. (m) XRD pattern of MnO2 NSs. (n) FT-IR spectra of MnO2 NSs, MBP NSs, and MBP-Ce6 NSs. (o) XPS spectra of MnO2 NSs and MBP-Ce6 NSs.
