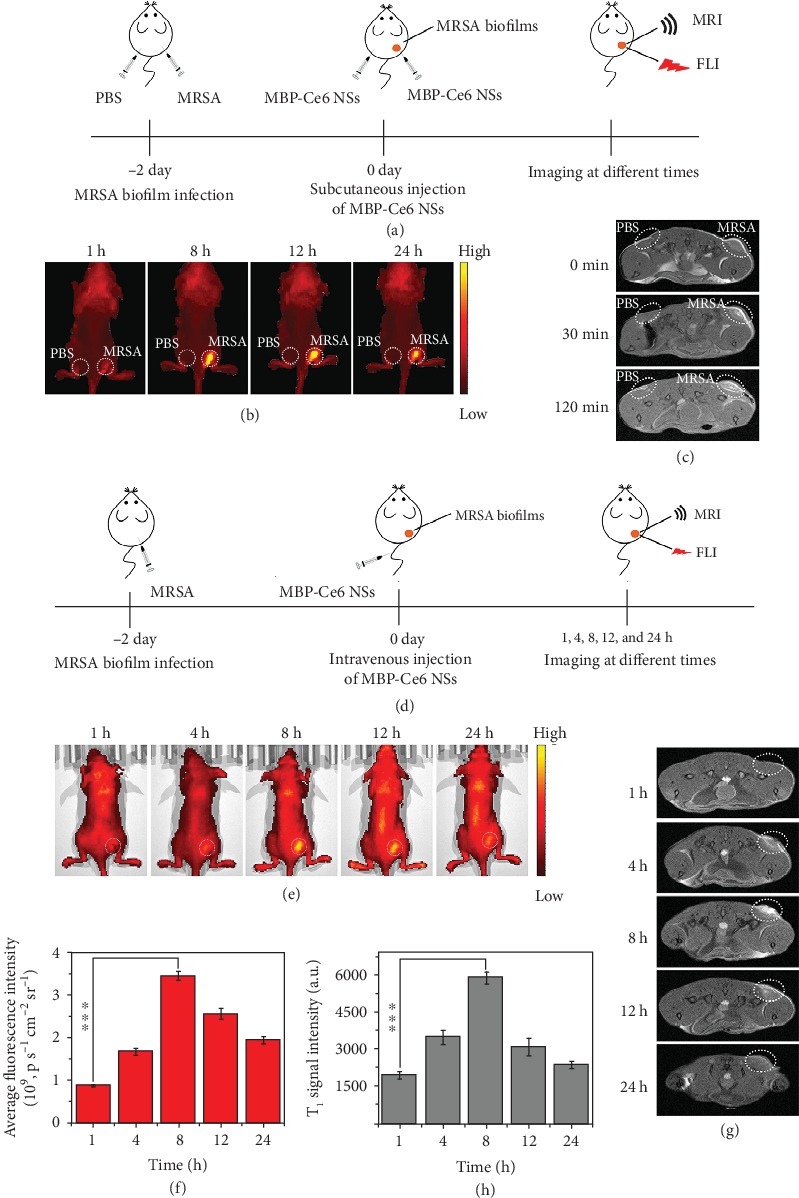
Figure 4.

In vivo fluorescence imaging (FLI) and magnetic resonance imaging (MRI) of MRSA biofilm infections by using MBP-Ce6 NSs. (a) Schematic illustration for the detection of MRSA biofilms by in situ injection of MBP-Ce6 NSs (50 μL; MnO2: 50 μg/mL; and Ce6: 40 μg/mL) both in the left thigh (normal tissue) and the right thigh (infected tissue). (b) Fluorescence images and (c) T1-weighted MR images of the infected mice at different times. (d) Schematic illustration of the process for the detection of MRSA biofilms by i.v. injection of MBP-Ce6 NSs. (e) Fluorescence images and the (f) fluorescence intensity of MRSA-infected mice at different times postinjection. (g) T1-weighted MR images shown in cross-section and (h) the intensity of the T1-weighted MR signal of the MRSA biofilm-infected tissues at different times postinjection. White dashed circles in (e) and (g) denote MRSA biofilm-infected tissues. ∗∗∗p < 0.001 (two-tailed Student's t-test). All data are presented as means ± s.d. (n = 3).
