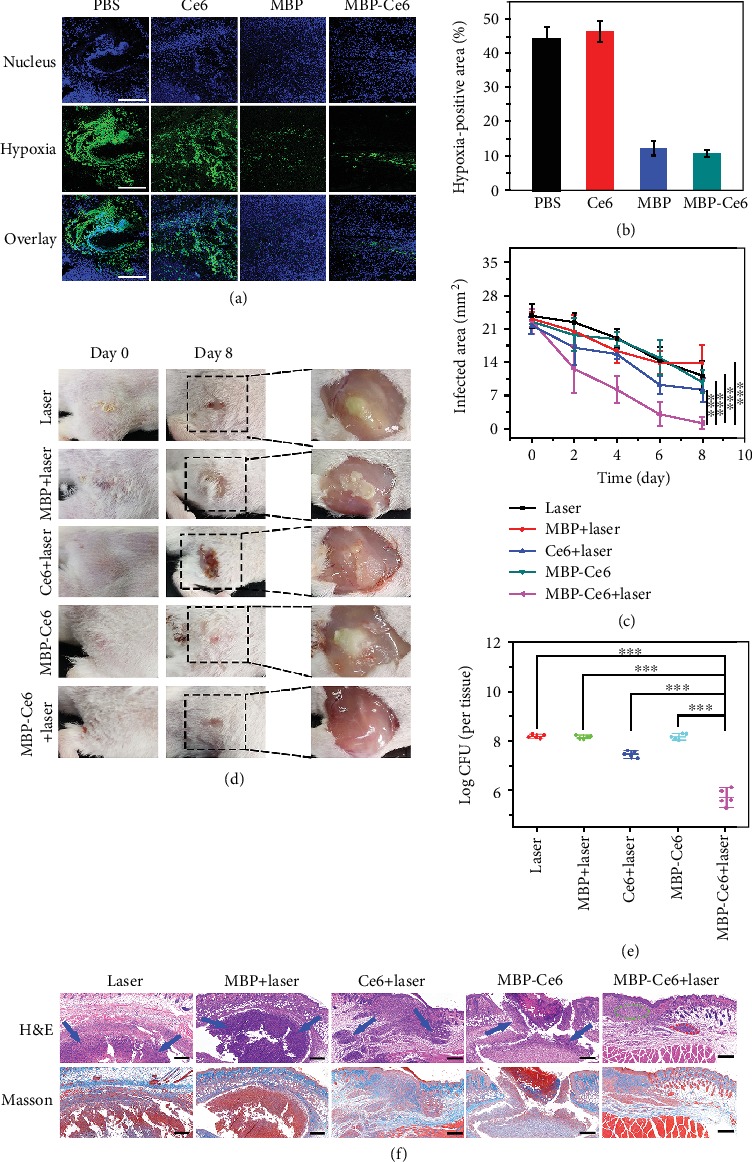
Figure 5.

Photodynamic treatment of MRSA biofilm infections in vivo. (a) CLSM immunofluorescence images of the infected tissue slices from the mice after i.v. injection with PBS, Ce6, MBP NSs, and MBP-Ce6 NSs for 8 h, respectively. The hypoxic condition was indicated by staining the slices with HIF-1α antibody (green) and 4′,6-diamidino-2-phenylindole (DAPI, blue). The scale bar is 200 μm. (b) Semiquantification of the hypoxia-positive area in biofilm-infected tissues after various treatments. (c) Biofilm-infected tissue areas of mice after different treatments at different times. (d) Photographs of the biofilm-infected tissues from the mice with various treatments at different times. (e) CFU of MRSA in biofilm-infected tissues at 8th day posttreatment. (f) Histological analysis of the biofilm-infected tissues by H&E and Masson's trichrome staining. Blue arrows denote the inflammatory cell infiltration. Green circle indicates the proliferation of fibroblast and neovascularization. Red circle indicates granulomatous inflammation. The scale bar is 200 μm. ∗∗∗p < 0.001 (two-tailed Student's t-test). All data are presented as means ± s.d. (n = 5).
