
Fig. 5.
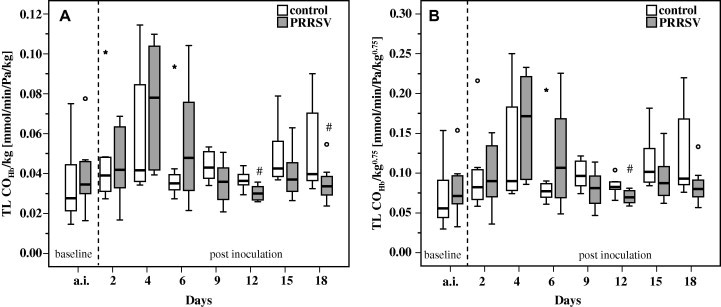
Transfer factor of carbon monoxide corrected for haemoglobin in relation to body weight (TL COHb/kg; A) and metabolic body weight (TL COHb/kg0.75; B) in pigs exposed to PRRSV (n = 8) and controls (n = 8). Box-and-whisker plot represents median value, 25% and 75% percentiles (box), range, outlier values (o) and extreme values (*). a.i. Represents data measured prior to inoculation (averaged per pig). # Indicates significant differences between PRRSV challenged pigs and controls (W-test, P ⩽ 0.05).