Figure 1.

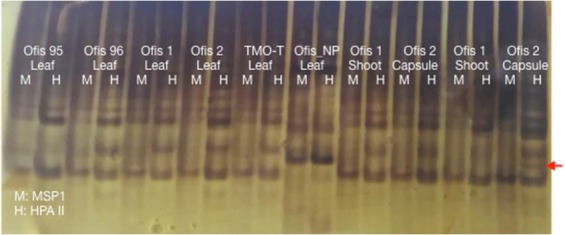
A representative polyacrylamide gel image. The sample names are given on the figure. A different band between the samples is shown as an arrow.

A representative polyacrylamide gel image. The sample names are given on the figure. A different band between the samples is shown as an arrow.