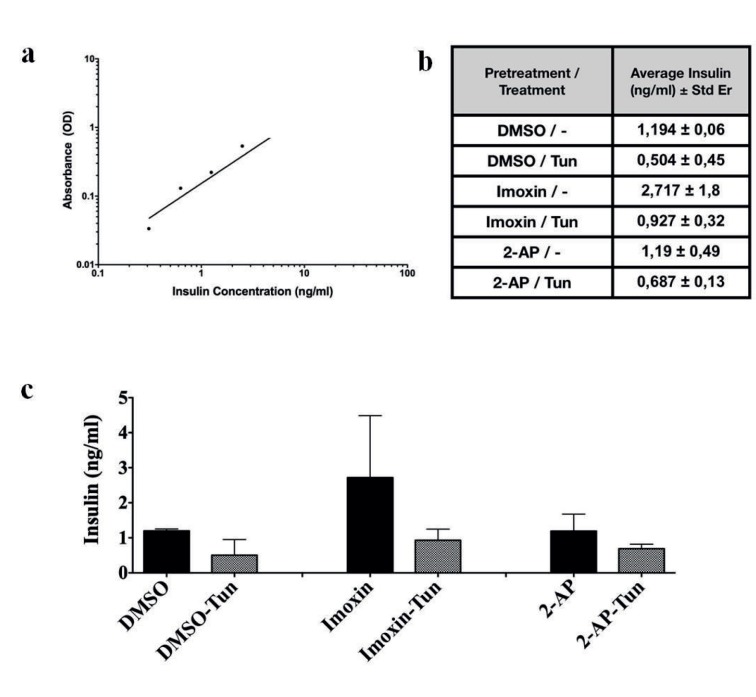
Figure 2.
The effect of PKR inhibition on intracellular insulin content. a) Standard curve of known insulin concentration vs. absorption indication the efficiency of the assay. b) Intracellular insulin concentrations (ng per mL cell lysate) are shown (pretreatment/tunicamycin concentration 8 μg/mL). c) Bar graph of intracellular insulin concentrations (ng per mL cell lysate) is shown (pretreatment/tunicamycin concentration).

