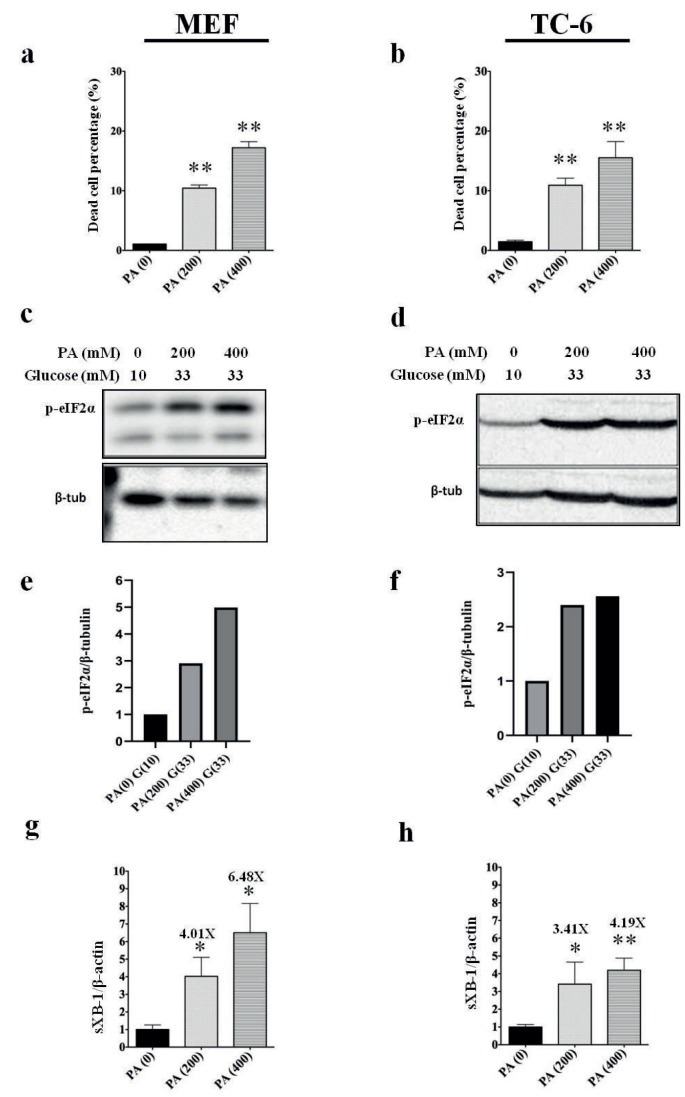
Figure 3.
Induction of ER stress by PA in high-glucose environment. a) Percentage of dead cells in mouse embryonic fibroblast line (MEF) after PA treatment. (**P < 0.005). b) Percentage of dead cells in Beta-TC-6 cell line after PA treatment. (**P < 0.005). c) Western blot analysis of elF2α phosphorylation (top picture) and β-tubulin (bottom picture) in MEF cells by PA. d) Western blot analysis of elF2α phosphorylation (top picture) and β-tubulin (bottom picture) in Beta-TC-6 cells by PA. e, f) Quantification of elF2α phosphorylation (normalized by β-tubulin expression) demonstrated by bar graph. g) Expression spliced XBP-1 mRNA in MEF cell lysates after PA treatment (*P < 0.05) normalized by actin mRNA expression. h) Expression of spliced XBP-1 mRNA in Beta-TC-6 cell lysates after PA treatment (*P < 0.05, **P < 0.005) normalized by actin mRNA expression.

