
Figure 1.
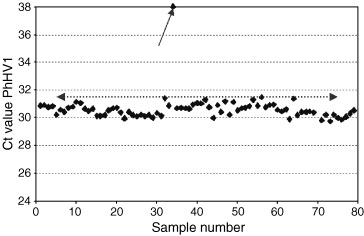
Data with the C t value of the amplification plot of seal herpes virus type 1 (PhHV‐1) added at a fixed concentration of approximately 5000–8000 copies/mL to each clinical sample. The results of a single experiment are shown, imported into a spreadsheet. The virus was coextracted using the MagnaPure LC isolation station, and quantified on an ABI7700 sequence detection system, using TaqMan universal reaction mixture (Applied Biosystems, Nieuwerkerk aan de Ijssel, The Netherlands). Primers and probe sequence were: forward primer 5′‐GGGCGAATCACAGATTGAATC, reverse primer 5′‐GCGGTTCCAAACGTACCAA, probe (labelled with TET) 5′‐TTTTTATGTGTCCGCCACCATCTGGATC. An amplification product of 89 bp within the gB gene is generated. The average C t value was 30.68 (average from 2359 samples analysed with this lot number), with an SD of 0.9. Samples in which the C t value for the internal control was > 32.5 (average plus 2 SD) had to be repeated (one in this run, see arrow).