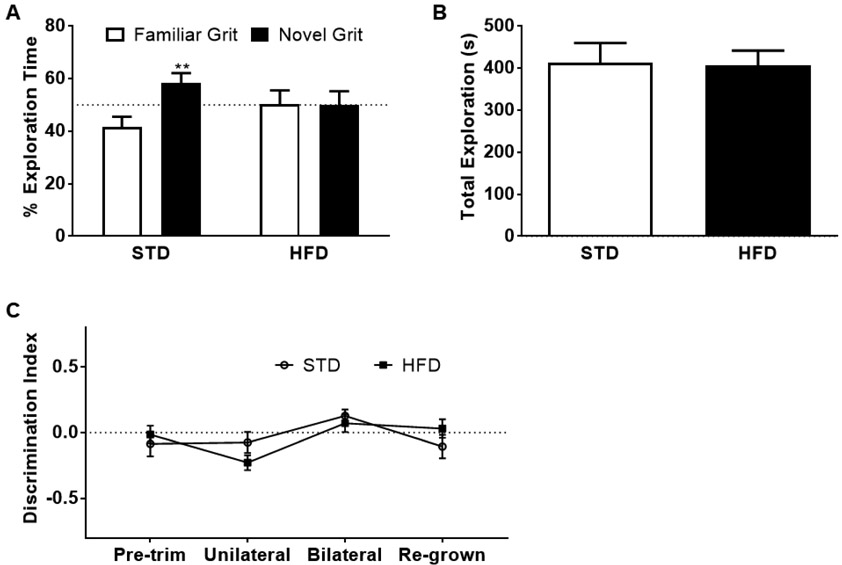
Figure 3. Tactile recognition memory impaired by HFD.
A) The percentage of time spent exploring the familiar and novel sandpaper grit and B) total exploration time of mice following 30-33 weeks of diet on either the standard diet (STD) or the high-fat diet (HFD) during novel tactile recognition (NTR). The dashed line represents 50% exploration; n= 7 and 8 for the STD and HFD groups, respectively. C) Discrimination index from corner test to distinguish the direction in which mice turn when approaching a corner following unilateral and bilateral whisker trim, and after 6 months of re-growth. The dashed line represents a discrimination index value of 0; data represented as mean and standard error of the mean (SEM); n= 9 and 12 in the STD and HFD groups, respectively; **p<0.01.

