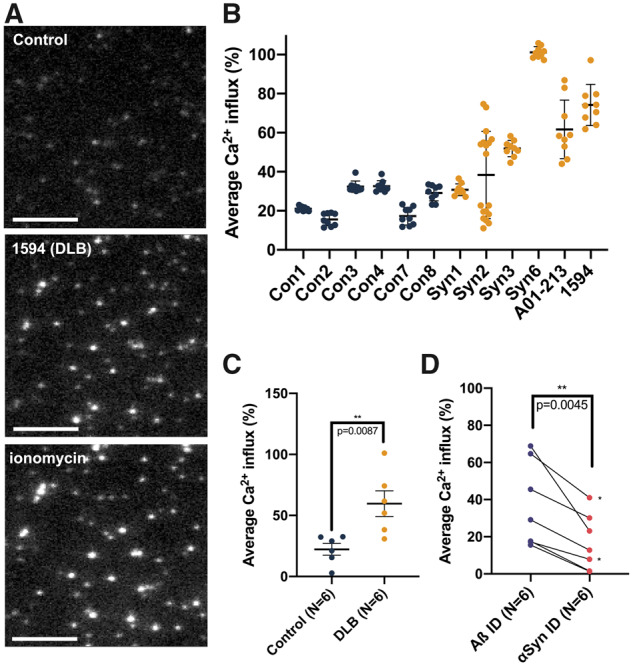
Figure 4.

Quantitative measurement of membrane permeabilization upon applying HMW fractions of soluble brain extracts via fluorescence imaging. (A) Images obtained through TIRF microscopy show an untreated vesicle sample (top, ‘Control’), a vesicle sample treated with soluble, HMW brain material from DLB patient 1594 (middle) and a sample treated with ionomycin as a positive control (bottom). Scale bars are 3 μm. (B) Brain homogenates display variable vesicle permeabilization capability between different cases but low variability within replicates of the same samples. Means with standard deviations are shown. (C) Mann–Whitney comparison of ranks analysing average Ca2+ influx measured from six DLB and six control brains reveals significantly elevated permeabilization of lipid membranes by soluble extracts from DLB patients (P = 0.0087). For each patient sample, nine technical replicates were used to generate the data point. Means with SEMs are shown. (D) Immunoneutralization of DLB cytosolic extracts with 2F12 anti-αSyn antibody (2F12, right) reduces the DLB extract-induced permeabilization of the vesicles compared to immunoneutralization anti-Aβ antibody (4G8, left) (paired T-test, P = 0.0045). For each patient sample, nine technical replicates were used to generate the data point. Each pair of points connected by a line represents a single cytosolic HMW extract. The two pairs of points denoted by a ‘*’ came from a single DLB brain (Syn2).
