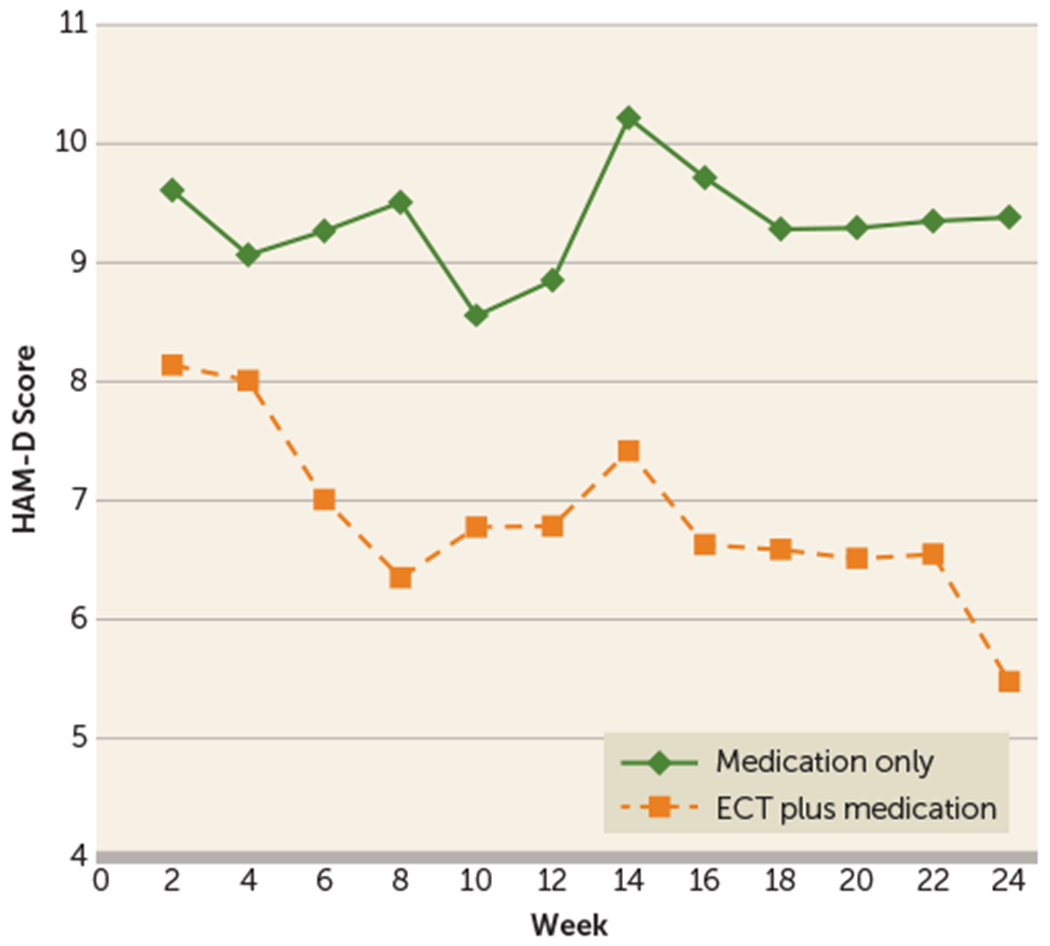
FIGURE 1. Longitudinal Trajectory of Modeled Hamilton Depression Rating Scale (HAM-D) Score Least Squares Means in a Study of Continuation ECT in Geriatric Depressiona.

a The graph shows baseline-adjusted least squares 24-item HAM-D mean scores from a basic mixed-effects repeated-measures model (unstructured covariance), with difference in baseline-adjusted least squares treatment means at study end (week 24) (Δ)=3.9 (95% CI=1.3, 6.5, p=0.004). For the model containing baseline HAM-D score, site, and psychosis, Δ=4.2 (95% CI=1.6, 6.9, p=0.002, unstructured covariance). Treatment-by-site, treatment-by-psychosis, and treatment-by-baseline HAM-D score interaction terms were not significant. For the comparison of the trajectories of HAM-D mean scores over time (time as continuous) in a mixed-effects model (baseline-adjusted model, unstructured covariance): treatment-by time interaction, p=0.084; main effect of time, p=0.001; main effect of treatment, p=0.12; and baseline HAM-D score, p<0.001. For analyses by treatment: main effect of time for the ECT plus medication group, p<0.001; main effect of time for the medication only group, p=0.398.
