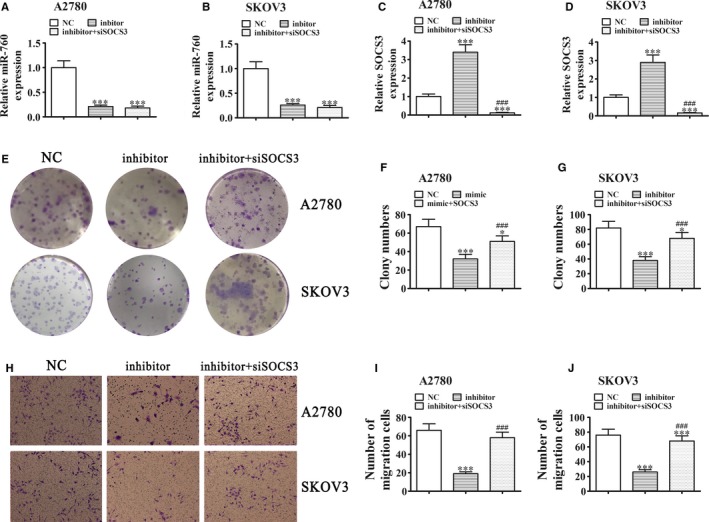
Figure 5.

Downregulation of SOCS3 restored the proliferation and migration ability of A2780 and SKOV3 cells transfected with a miR‐760 inhibitor. A‐D, qRT‐PCR detection showing the expression of miR‐760 (A and B) and SOCS3 (C and D) in A2780 and SKOV3 cells transfected with NC, miR‐760 inhibitor, or siSOCS3 alone or in combination. Data are presented as the mean ± SD. ***P < .001 vs NC. ### P < .001 vs inhibitor. E‐G), Colony formation assays. Data are presented as the mean ± SD. *P < .05, ***P < .001 vs NC. ### P < .001 vs inhibitor. H‐J, Cell migration was assessed in A2780 and SKOV3 cells using Transwell assays. Data are presented as the mean ± SD. *** P < .001 vs NC. ### P < .001 vs inhibitor
