
Figure 2.
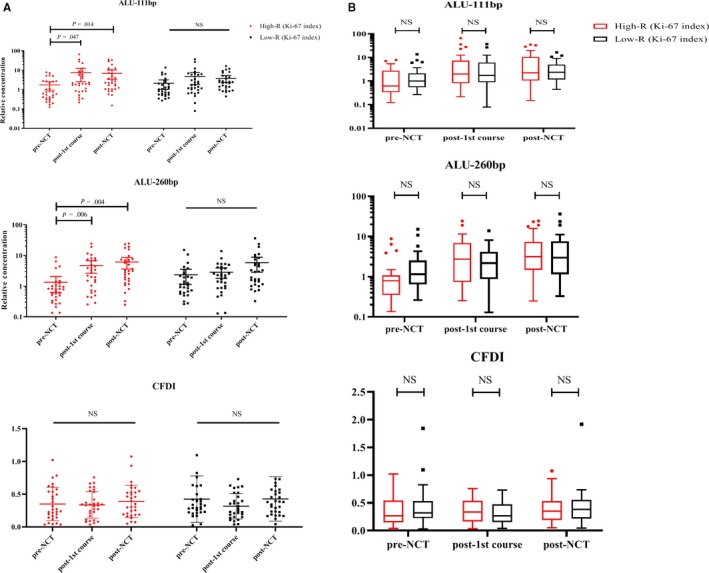
Correlation between cfDNA levels and patients with different changes in the Ki‐67 index. A, The levels of both Alus increased after the first and the eighth NCT in the high‐R group. The cfDNA level remained stable during NCT in the low‐R group. No significant difference was observed during NCT in any of the groups. B, No significant difference in both Alus and CFDI was found between different NCT response groups during NCT