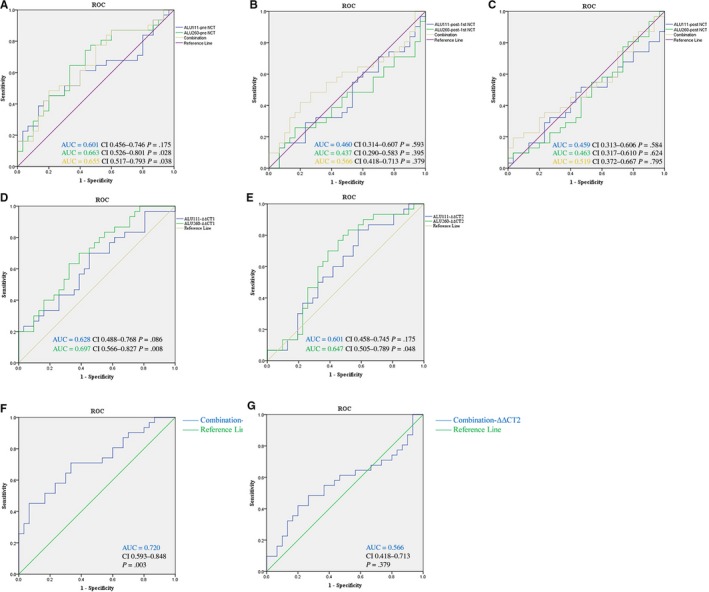
Figure 3.

Receiver operating characteristic (ROC) curves for cfDNA for discriminating the low‐response group from the high‐response group. AUC, Area under the curve. A, Relative levels of both Alus and a combined result before NCT. B, Relative levels of both Alus and a combined result after the first NCT. C, Relative levels of both Alus and a combined result after NCT. D, The ∆∆Ct1 (the difference between the ∆Ct at the first two points) of both Alus. E, The ∆∆Ct2 (the difference between the ∆Ct at the beginning and the end time points). F, Combined results of the ∆∆Ct1. G, Combined results of the ∆∆Ct2
