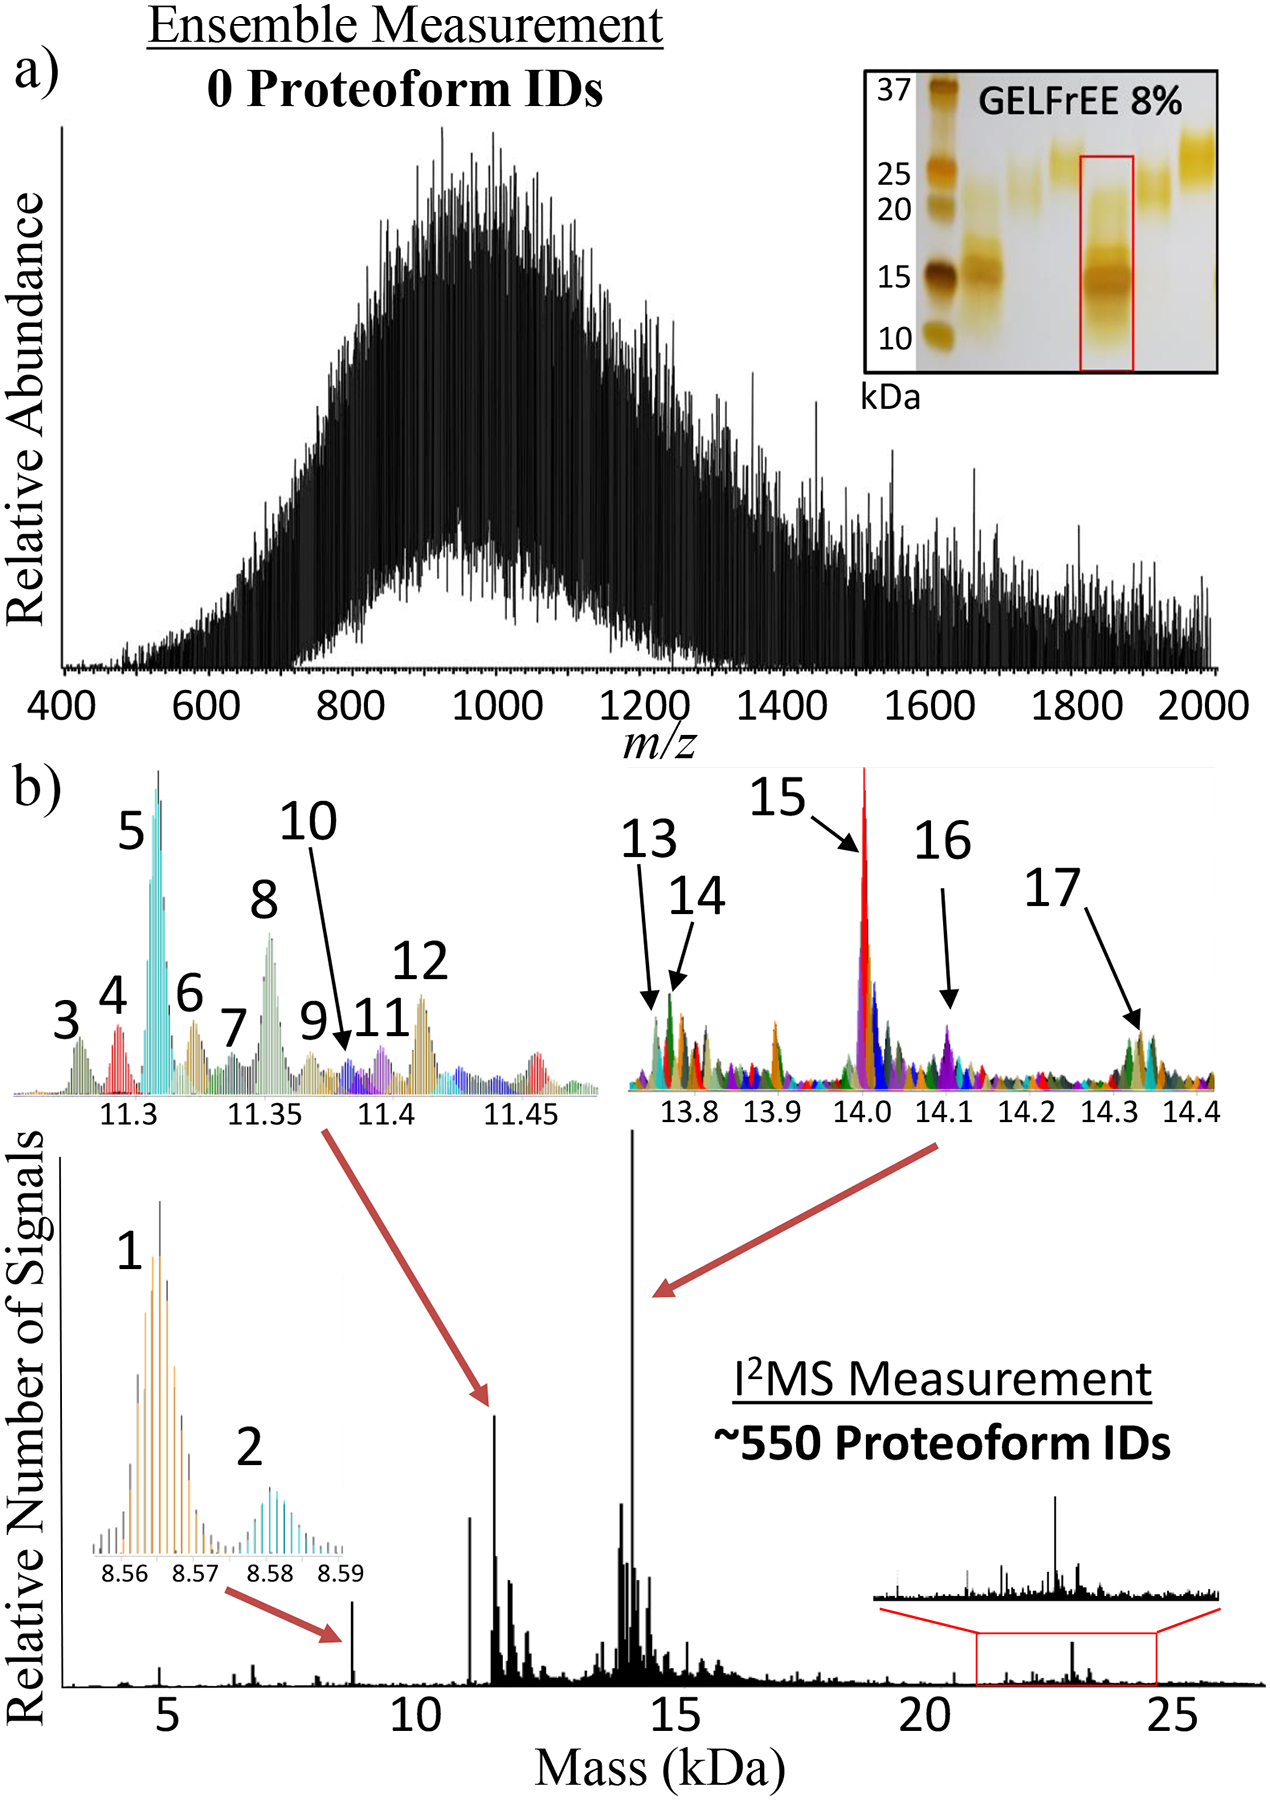
Figure 2. Deconvolution of Complex Proteoform Mixtures.

Comparison of the number of proteoform assignments possible using either conventional spectral acquisition with an ensemble of ions in a population (a) or the I2MS process (b). This comparative analysis involved directly infusing a mixture of 0 – 30 kDa proteins created by fractionation of whole extracts from HEK-293 human cells. The inset in panel (a) shows an analytical, silver-stained gel, with the fraction analyzed highlighted with a red rectangle. The 3 insets in panel (b) highlight 17 of the 550 total proteoforms assigned, which are listed in Supplemental Table 1 and include their proteoform record numbers (PFRs). The 20–25 kDa region highlighted with a red rectangle in panel (b) corresponds to proteoforms of higher mass proteins in the complex mixture previously unidentified using LC-MS/MS for top-down proteomics.
