
Figure 1. Impaired motor skill learning in mice prenatally exposed to alcohol.
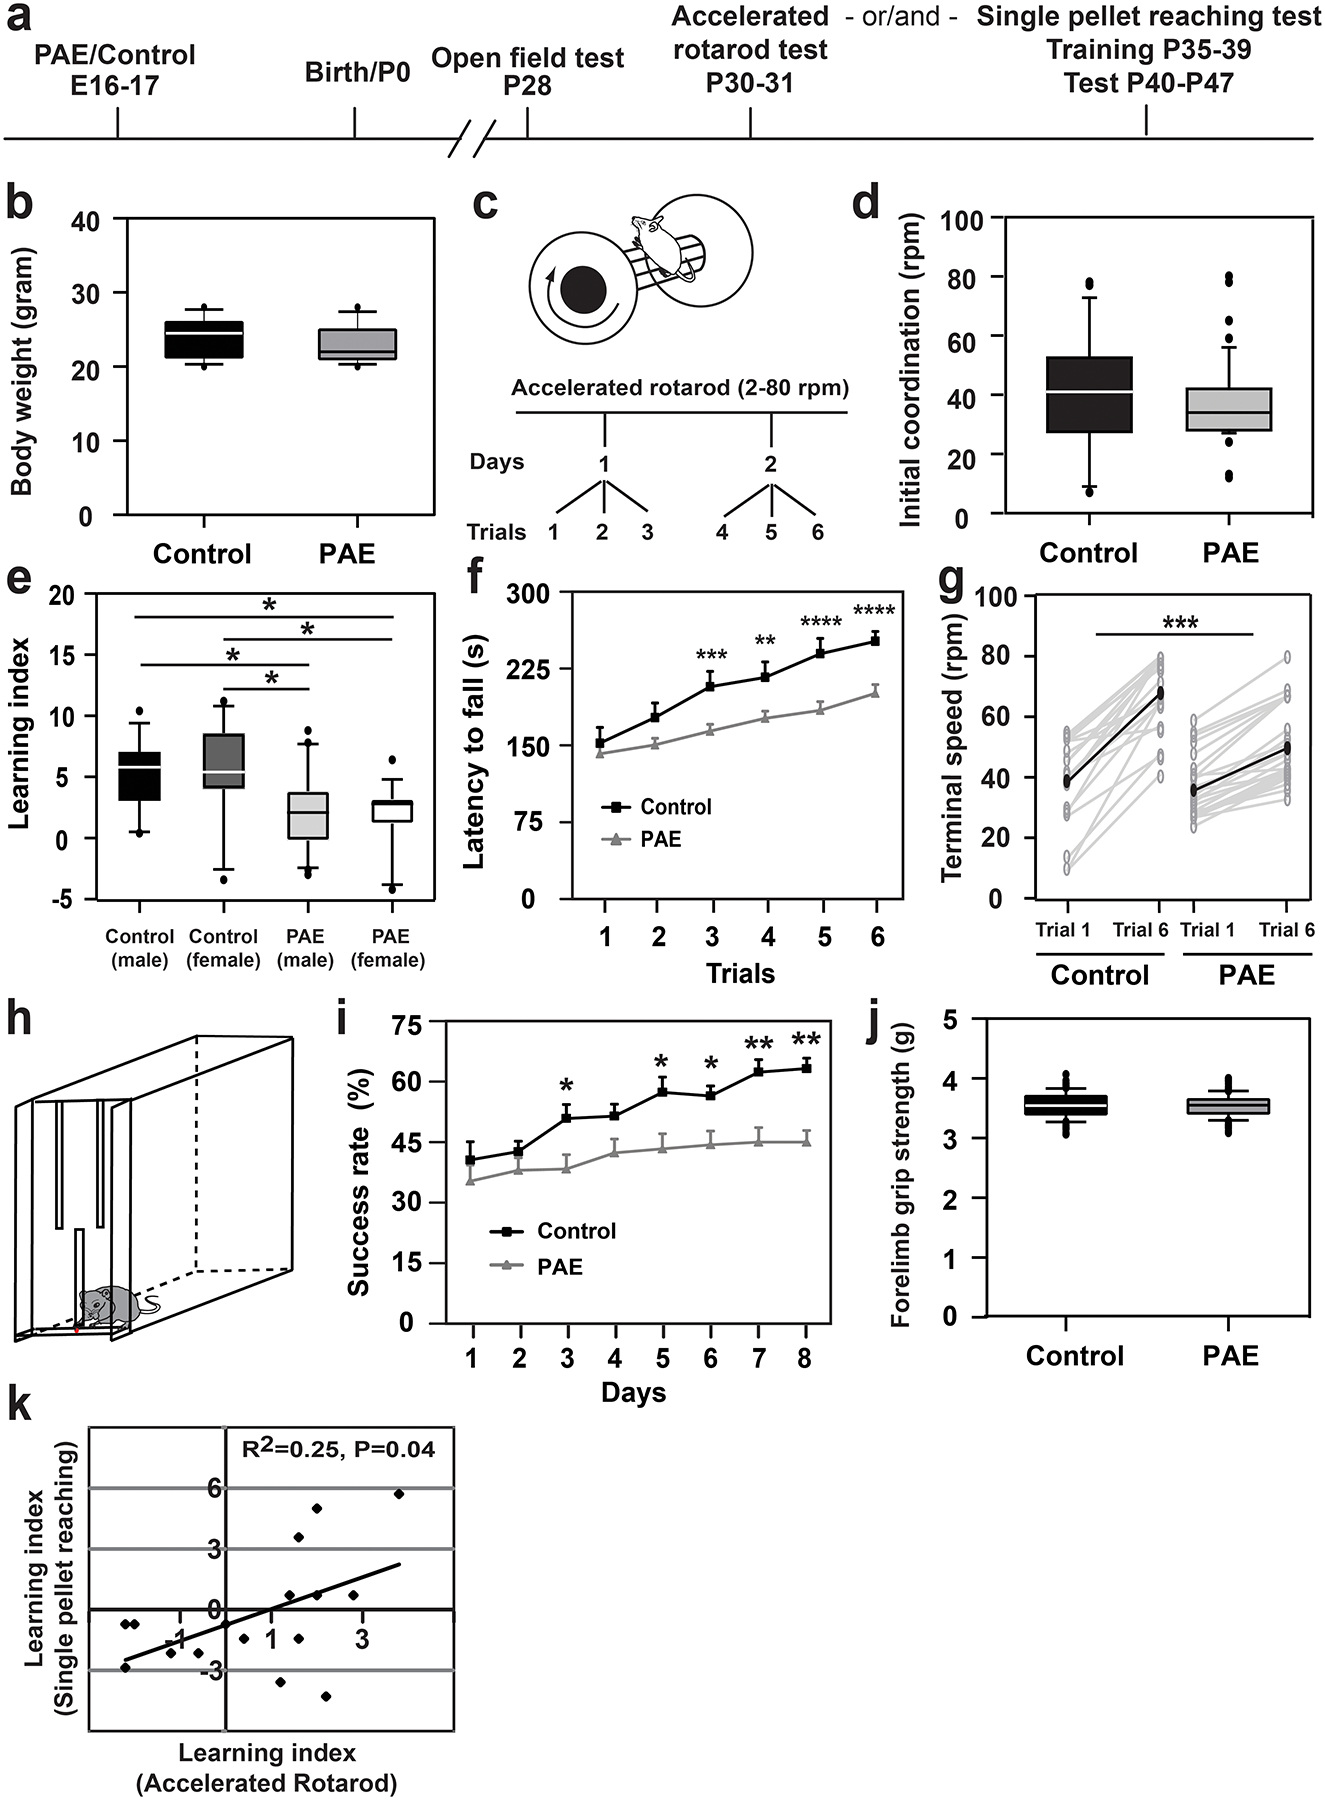
(a) Experimental timeline. (b) Body weight is unaffected by prenatal alcohol exposure (PAE); P = 0.43 by two-tailed Student’s t-test [n = 12 animals (including both sexes) per group]. (c) Experimental paradigm of accelerated rotarod test. (d) Initial motor coordination (terminal speed at trial 1) is not affected by PAE; P = 0.31 by two-tailed Mann-Whitney U test (control: n = 25 animals, PAE: n = 49 animals). (e) The learning indices of PAE mice are significantly lower than those of controls, but not affected by sex; F(1,60) = 15.19, P = 0.0002 and F(1,60) = 0.0003, P = 0.99, respectively by two-way ANOVA. *P < 0.05 by Tukey test [control (male): n = 14 animals, control (female): n = 11 animals, PAE (male): n = 20 animals, PAE (female): n = 19 animals]. (f) Latency to fall at each trial in the rotarod test. A significant interaction between the effects of exposure type (PAE or control) and trial was observed; F(5,72) = 2.73, P = 0.02 by two-way repeated measures ANOVA. PAE mice show significantly shorter latency to fall from the 3rd trial; **P < 0.01, ***P < 0.005, ****P < 0.001 by simple main effect test (control: n = 25 animals, PAE: n = 49 animals). Graph shows mean ± Standard Error of the Mean (SEM). (g) The increases of terminal speeds between trials 1 and 6 were compared between control and PAE mice. Gray and black lines show the data for individual mice and the means, respectively. The increase was significantly smaller in PAE mice; ***P < 0.0001 by two-tailed Student’s t-test (control: n = 20 animals, PAE: n = 26 animals). (h) Schematic of the single-pellet reaching test box. (i) PAE mice show lower success rates; F(1,30) = 43.42, P < 0.0001, by two-way repeated measures ANOVA, *P < 0.05, **P < 0.01 by Tukey test (control: n = 14 animals, PAE: n = 10 animals). Graph shows mean ± SEM. (j) Forelimb grip strength is not affected by PAE. P = 0.92 by two-tailed Student’s t-test (n=10 animals per group). (k) Pearson’s correlation analysis reveals a positive correlation between learning indices of the rotarod and pellet reaching tests on PAE mice; Pearson’s correlation of determination r2 = 0.25, P = 0.04 (n = 16 animals per group). Separate groups of animals were used for rotarod and single pellet reaching tests, except for the correlation study (k), in which the rotarod test was performed before the single pellet reaching test on the same mice. In box plots (b, d, e, j), the line within the box indicates the median, and the upper and lower edges of the box represent the 25th and 75th percentiles, respectively. The upper and lower whisker boundaries indicate the 10th and 90th percentiles, respectively, and dots indicate outliers.