
Figure 4. Increase of Kcnn2-expressing neurons in M1 in PAE mice.
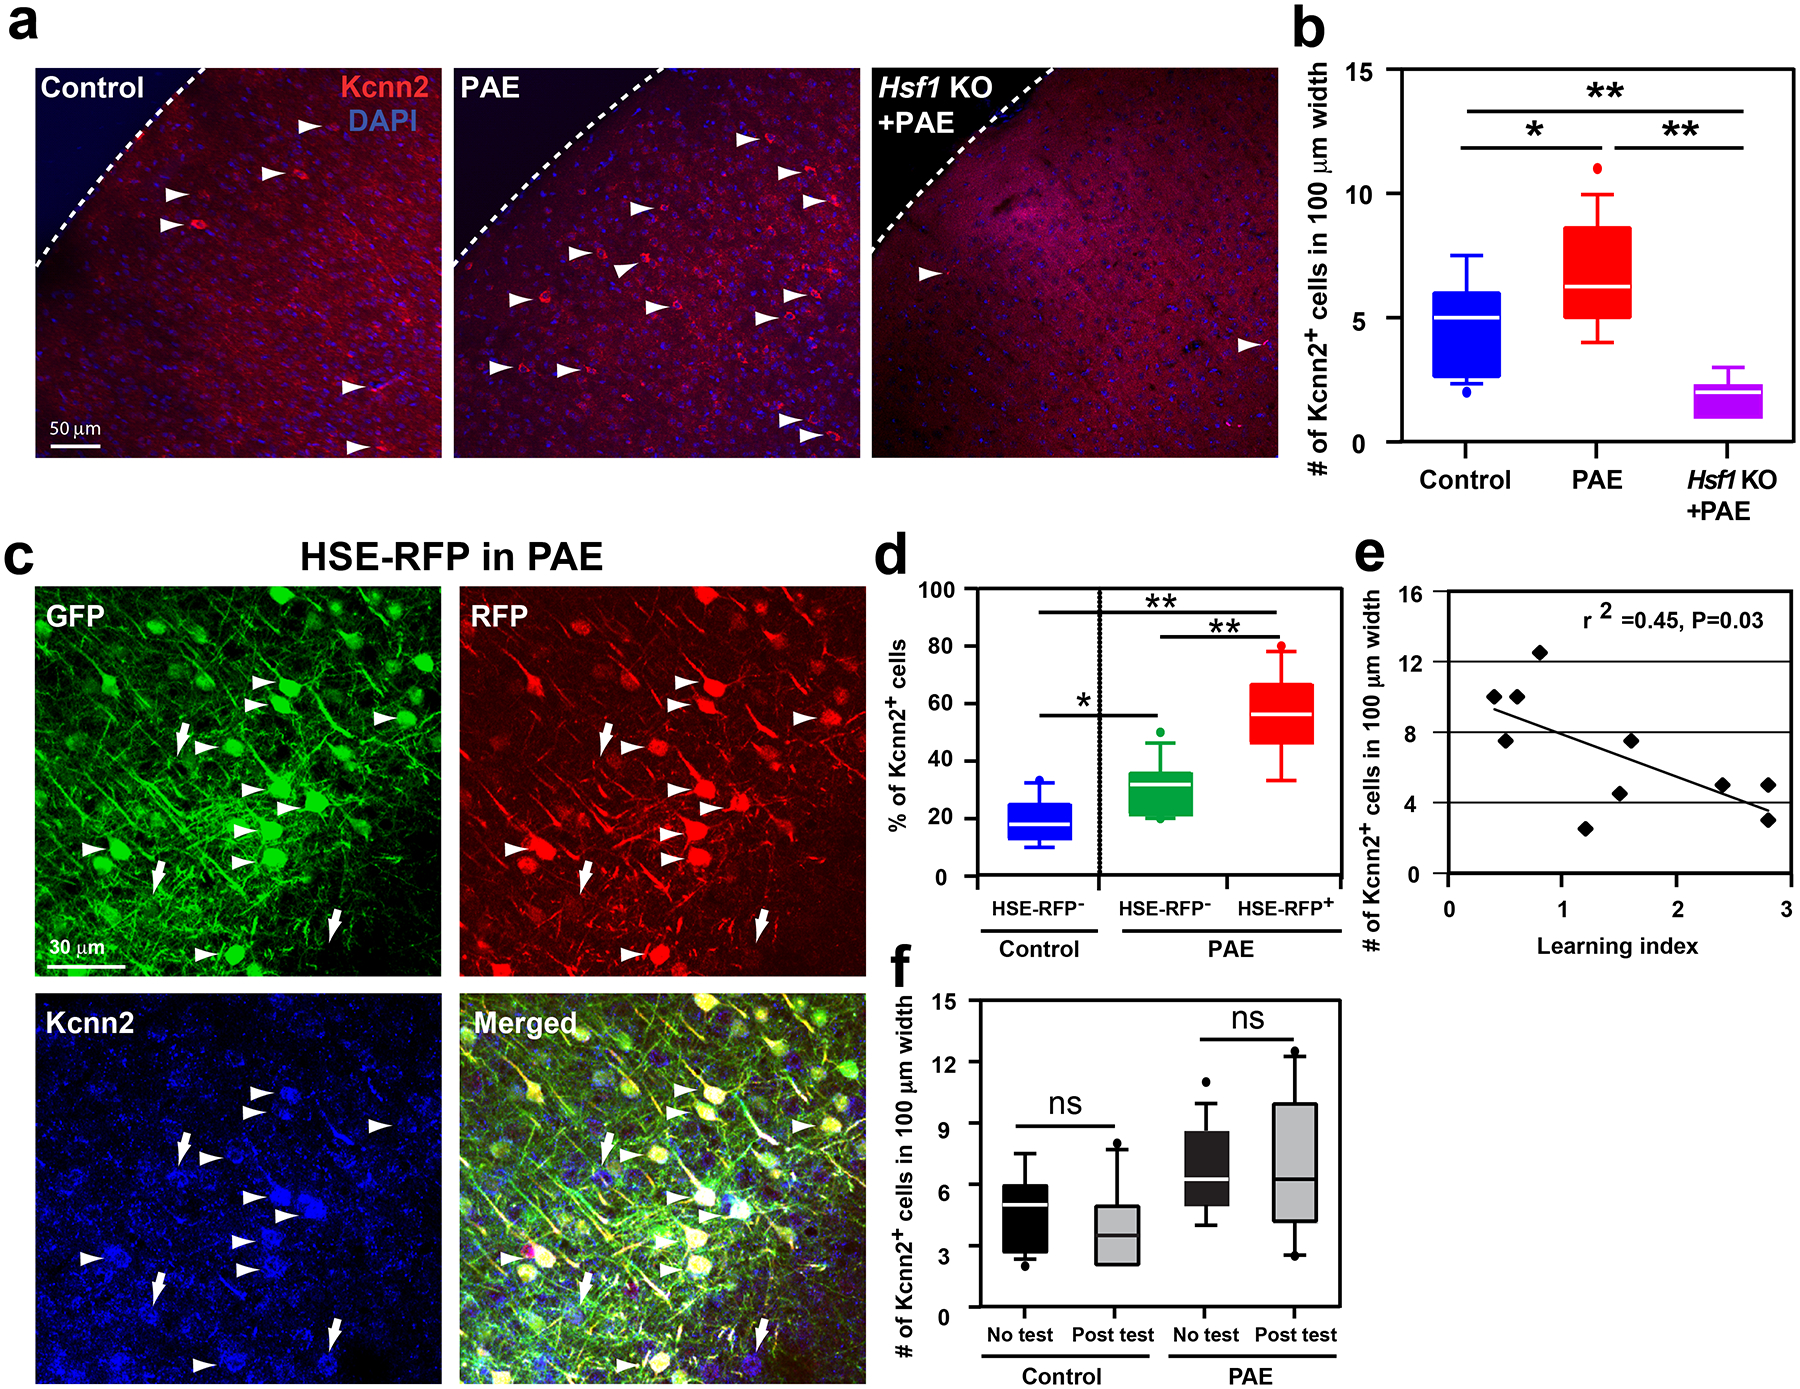
(a, b) Kcnn2 immunohistochemistry at P30 (a) and quantification of labeled neurons in layer III in M1 (b). The number of Kcnn2+ cells (arrowheads in a) is increased in PAE mice compared to that in control (PBS-exposed) mice. The increase of Kcnn2+ cells by PAE is not observed in Hsf1 KO mice; F(2,39) = 23.51, P < 0.0001 by one-way ANOVA, *P < 0.05, **P < 0.01 by Tukey test (control: n = 5 animals, PAE: n = 5 animals, Hsf1 KO+PAE: n = 4 animals). (c) Among GFP+ (green) electroporated neurons, Kcnn2 expression (blue) is enriched in HSE-RFP reporter+ (red) neurons in PAE mice (arrowheads) (arrows indicate Kcnn2+ cells that are also found among non-electroporated cells). Images are representatives of similar results obtained from n = 4 animals. (d) The percentage of neurons positive for Kcnn2 among HSE-RFP reporter+ neurons (in PAE mice) is significantly higher than that of reporter− neurons (in PAE or Control mice) among all GFP+ electroporated layer III neurons in M1; F(2,34) = 38.40, P<0.0001 by one-way ANOVA, *P < 0.05, **P < 0.01 by Tukey test (control: n = 4 animals, PAE: n = 4 animals). (e) Pearson’s correlation analysis demonstrates a negative correlation between learning index (accelerated rotarod test) and the number of Kcnn2+ cells in layer III in M1. Pearson’s correlation of determination r2 = 0.45, P = 0.03 (n = 10 animals per group). (f) Kcnn2 expression is not altered by motor learning itself. P = 0.35 and 0.98 by two-tailed Student’s t-test for control group and PAE group, respectively (no test: n = 16 animals, post test: n=10 animals per group). In box plots (b, d, f), the line within the box indicates the median, and the upper and lower edges of the box represent the 25th and 75th percentiles, respectively. The upper and lower whisker boundaries indicate the 10th and 90th percentiles, respectively, and dots indicate outliers.