
Extended Data Fig. 7. Genetic relationships among brain disorders.
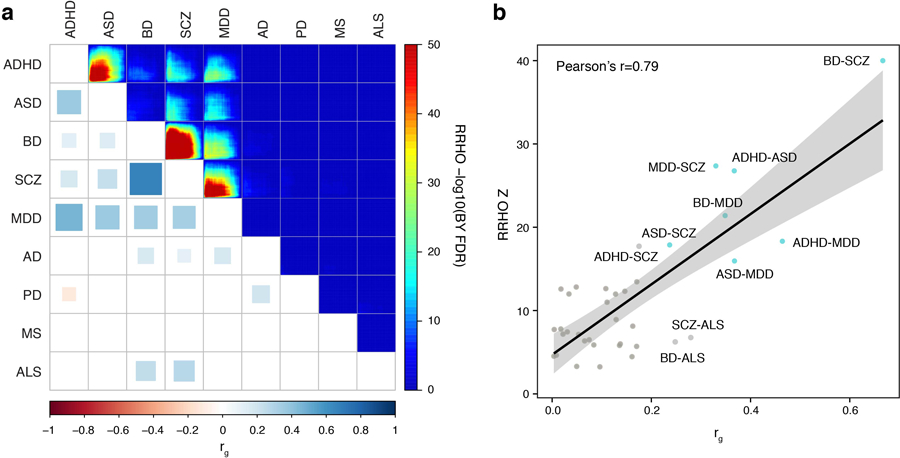
a. Psychiatric disorders show strong genetic relationships both at the level of genetic correlations (bottom left, rg) and gene-level overlaps (top right, RRHO). BY FDR, P-values adjusted by the Benjamini and Yekutieli procedure. b. Genetic correlations measured with Pearson’s correlation (rg) and gene-level overlaps (RRHO Z) are highly correlated, indicating that gene-level overlaps obtained by H-MAGMA recapitulate genetic correlations. Brain disorders that show strong genetic correlations (rg > 0.2) and gene-level overlaps (RRHO Z > 15) are marked in blue. Linear regression line with 95% confidence bands.