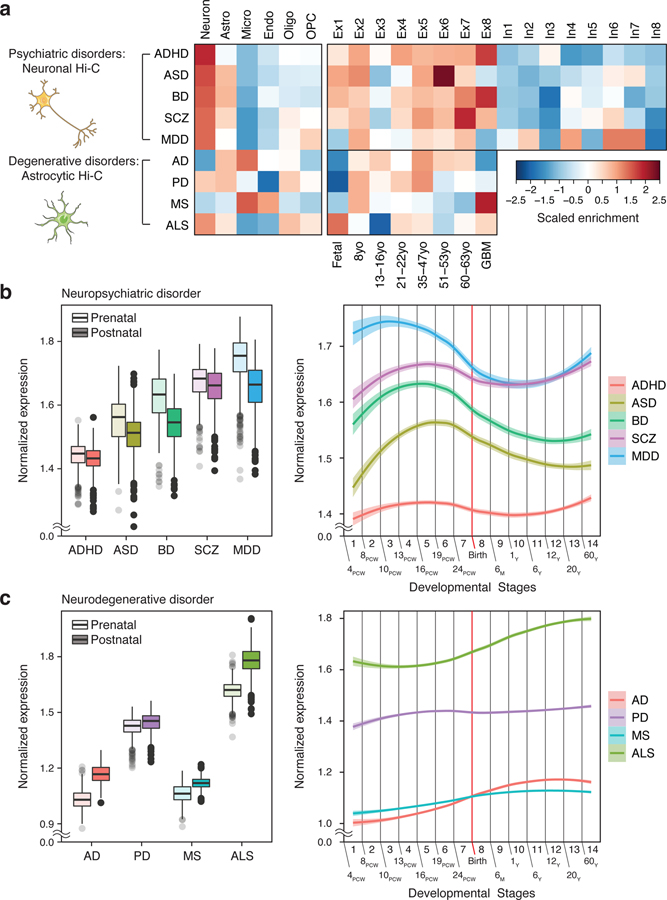
Fig. 3. Cellular expression profiles of brain disorder risk genes.
a. We used neuronal and astrocytic H-MAGMA to annotate psychiatric disorder and degenerative disorder GWAS, respectively. Psychiatric disorder-associated genes are highly expressed in neurons, while neurogenerative disorder-associated genes exhibit glial signatures. Astro, astrocytes; Micro, microglia; Endo, endothelial cells; Oligo, oligodendrocytes; OPC, oligodendrocytes progenitor cells; Ex, excitatory neurons; In, inhibitory neurons; GBM, glioblastoma multiforme tumor. b-c. Developmental expression trajectories of psychiatric disorder-associated genes (b) and degenerative disorder-associated genes (c). PCW, post-conception week; M, month; Y, year. (Left) N = 410 and 453 for prenatal and postnatal samples, respectively. Center, median; box=Q1-Q3; minima, Q1 – 1.5 x IQR; maxima, Q3 + 1.5 x IQR. (Right) LOESS smooth curve with 95% confidence bands.

