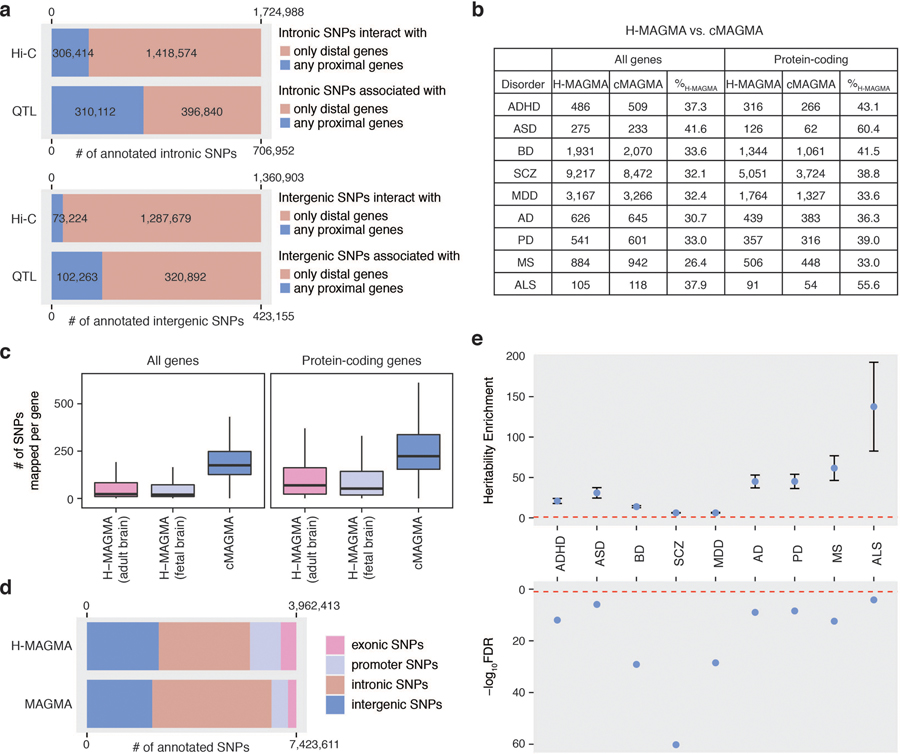
Extended Data Fig. 1. Comparison between H-MAGMA and cMAGMA.
a. The number and proportion of intronic and intergenic SNPs annotated to proximal and distal genes. SNPs mapped to proximal genes may also have distal associations, while SNPs mapped to distal genes do not have any association with proximal genes. b. The number of brain disorder risk genes (genes that are significantly associated with each brain disorder at a threshold of FDR<0.05) predicted by H-MAGMA and cMAGMA. % H-MAGMA denotes the percentage of H-MAGMA selective genes (genes that were identified by H-MAGMA but not by cMAGMA). c. The number of SNPs assigned to each gene for H-MAGMA and cMAGMA. Center, median; box=1st-3rd quartiles (Q); minima, Q1 – 1.5 x interquartile range (IQR); maxima, Q3 + 1.5 x IQR. d. The number and proportion of SNPs annotated to the cognate genes by H-MAGMA and cMAGMA. e. H-MAGMA selective SNPs (SNPs assigned to H-MAGMA selective genes in H-MAGMA – SNPs assigned to H-MAGMA selective genes in cMAGMA) explain a significant proportion of heritability. Top graph: Heritability enrichment ± standard error; enrichment denotes proportion of heritability/proportion of SNPs; red dotted line, enrichment=1. Bottom graph: false discovery rate (FDR) of heritability enrichment: red dotted line, FDR=0.05.

