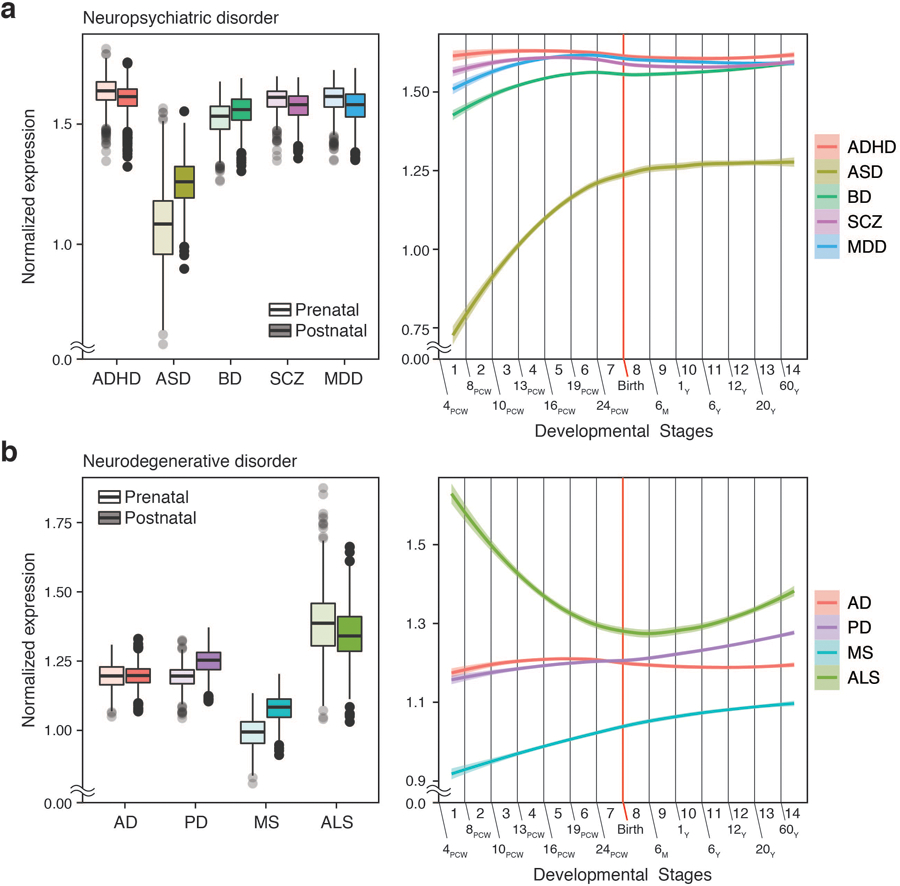
Extended Data Fig. 3. Developmental expression trajectories of brain disorder risk genes derived from cMAGMA.

PCW, post-conception week; M, month; Y, year. (Left) N = 410 and 453 for prenatal and postnatal samples, respectively. Center, median; box=Q1-Q3; lower whisker, Q1 – 1.5 x IQR; upper whisker, Q3 + 1.5 x IQR. (Right) LOESS smooth curve with 95% confidence bands.
