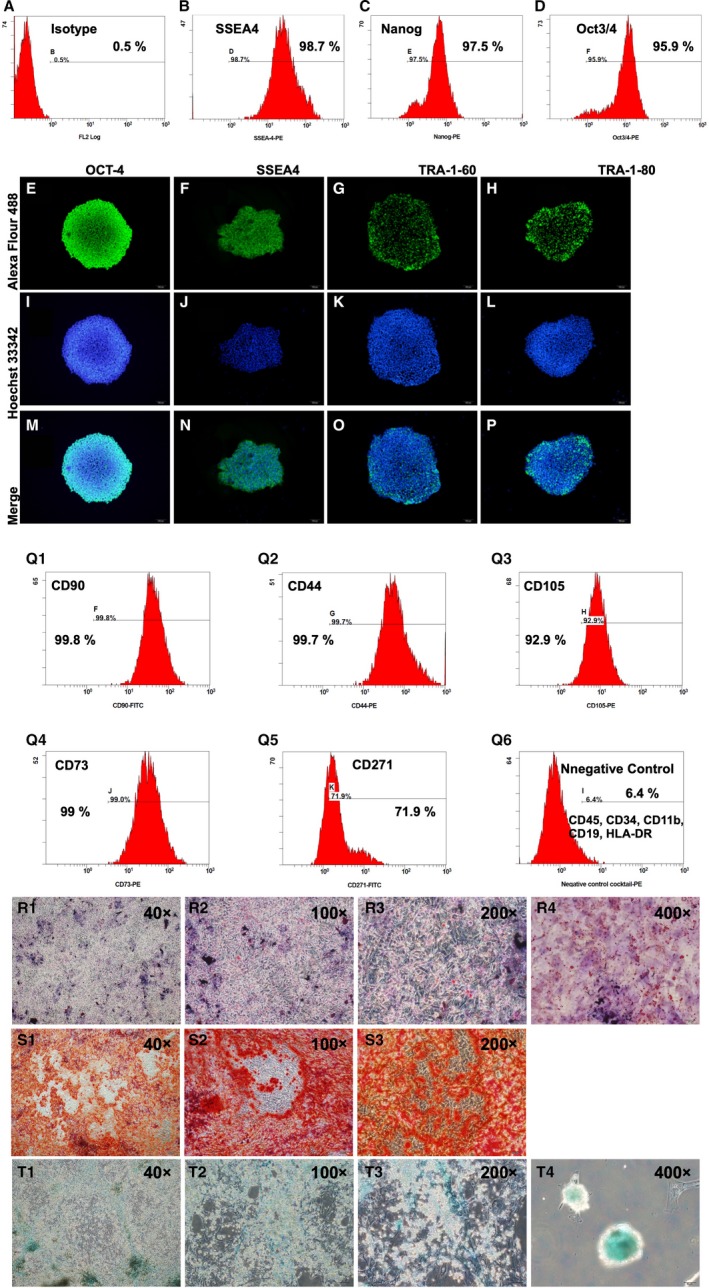
Figure 1.

Flow cytometric analysis and IF microscopic findings for identification the feature of iPS and iPS‐MSC surface markers, and cell‐culture results of iPSC‐derived MSCs differentiated into adipocytes, chondrocytes and osteocytes. A, Indicated isotype of flow cytometric analysis (ie negative control). B to D, Illustrating the flow cytometric analysis for identifying the expression of induced pluripotent stem cell (iPS) surface makers of SSEA4+ (B), Nanog+ (C) and Oct3/4+ (D) cells. E to P, Illustrating the immunofluorescent (IF) microscopic finding (400x) for identify the morphological features of iPS during cell culturing and their distinctive surface markers of positively stained OCT‐4, SSEA4, TRA‐1‐60 and TRA‐1‐80. M to P, Expressed the merge results of Alexa Fluor488 and Hoechst33342 of these four iPS cells. Q1 to Q5, Illustrating the flow cytometric results of cell culture for identification of percentage of CD90+, CD44+, CD105+, CD73+ and CD271+, five typical iPS‐derived mesenchymal stem cell (MSC) surface markers. Q6, Indicated the negative control of flow cytometric analysis. 1‐R1 to R4, Illustrating the microscopic finding of immunofluorescent (IHC) stain for identification of iPSC‐derived MSCs differentiated into adipocytes. S1 to S3, Illustrating the microscopic finding of IHC stain for identification of iPSC‐derived MSCs differentiated into osteocytes. T1 to T4, Illustrating the microscopic finding of IHC stain for identification of iPSC‐derived MSCs differentiated into chondrocytes
