Figure 6.

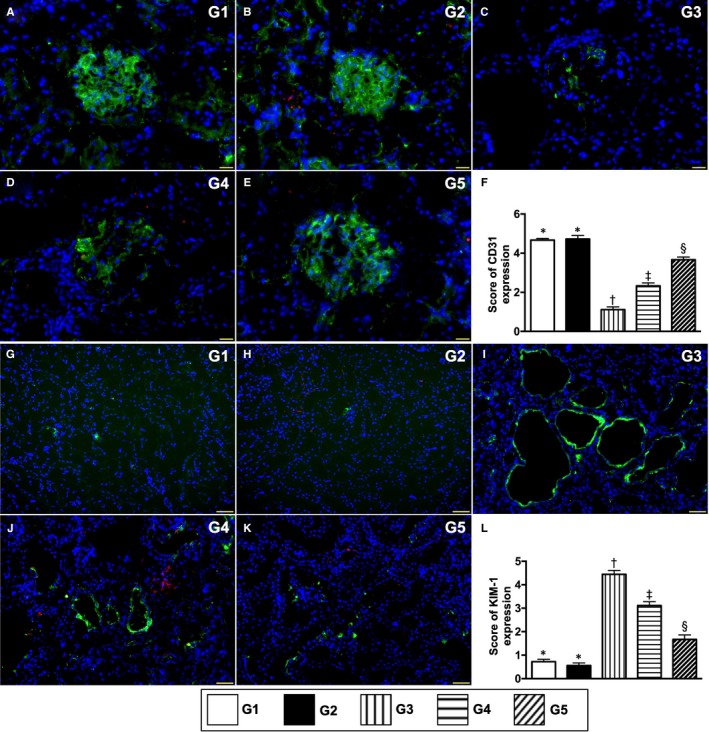
Cellular expression of endothelial cell and renal tubular injury biomarkers by day 60 after CKD induction. A to E, Illustrating the immunofluorescent (IF) microscopic finding (400x) for identification of CD31+ cells (green colour). F, Score of CD31 cell expression, * vs other groups with different symbols (†, ‡, §), P < .0001. G to K, Illustrating the IF microscopic finding (400×) for identification of positively stained kidney injury molecule (KIM) cells (green colour). L, Score of KIM cell expression, * vs other groups with different symbols (†, ‡, §), P < .0001. Red colour in B, D, E, H, J and K indicated some residual iPS‐MSCSPIONs kidney parenchyma. Scale bars in right lower corner represent 50µm. All statistical analyses were performed by one‐way ANOVA, followed by Bonferroni multiple comparison post hoc test (n = 6 for each group). Symbols (*, †, ‡, §) indicate significance (at 0.05 level). G1 = sham‐operated control (SC); G2 = SC + iPS‐MSCSPIONs (1.0 × 10⁶ cells); G3 = CKD; G4 = CKD + iPS‐MSCSPIONs (0.5 × 10⁶ cells); G5 = CKD + iPS‐MSCSPIONs (1.0 × 10⁶ cells). CKD, chronic kidney disease; iPS‐MSC, induced pluripotent stem cells‐derived mesenchymal stem cells; iPS‐MSCSPIONs, the iPS‐MSC was labelled by paramagnetic contrast agent
