
Figure 9.
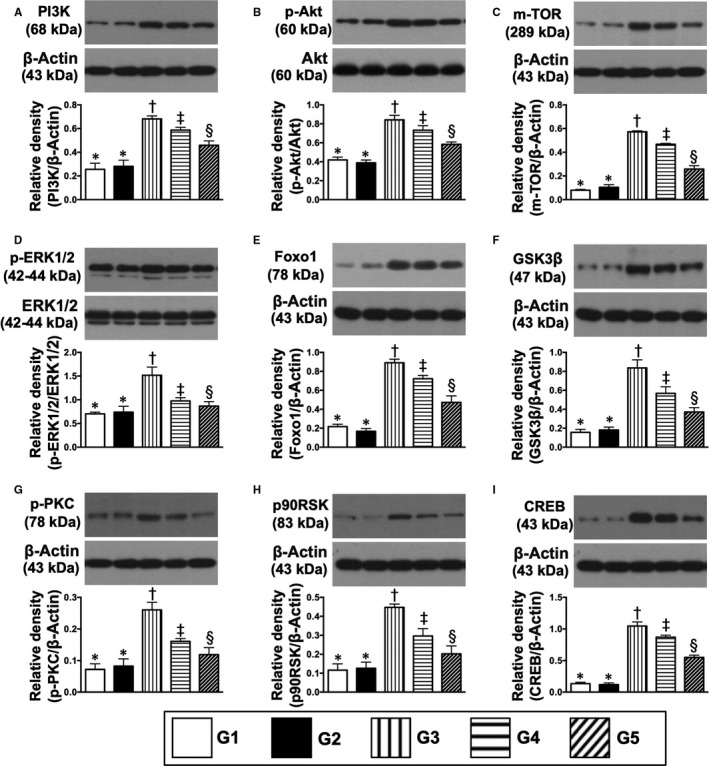
Protein expression of cell death/proliferation signalling pathways in kidney parenchyma by day 60 after CKD induction. A, Protein expressions of PI3K, * vs other groups with different symbols (†, ‡, §), P < .0001. B, Protein expression of phosphorylated (p)‐Akt, * vs other groups with different symbols (†, ‡, §), P < .0001. C, Protein expression of m‐TOR, * vs other groups with different symbols (†, ‡, §), P < .0001. D, Protein expression p‐ERK1/2, * vs other groups with different symbols (†, ‡, §), P < .0001. E, Protein expression of Foxo1, * vs other groups with different symbols (†, ‡, §), P < .0001. F, Protein expression of GSK3β, * vs other groups with different symbols (†, ‡, §), P < .0001. G, Protein expression of p‐PKC, * vs other groups with different symbols (†, ‡, §), P < .0001. H, Protein expression of p90RSK, * vs other groups with different symbols (†, ‡, §), P < .0001. I, Protein expression of CREB, * vs other groups with different symbols (†, ‡, §), P < .0001. All statistical analyses were performed by one‐way ANOVA, followed by Bonferroni multiple comparison post hoc test (n = 6 for each group). Symbols (*, †, ‡, §) indicate significance (at 0.05 level). G1 = sham‐operated control (SC); G2 = SC + iPS‐MSCSPIONs (1.0 × 10⁶ cells); G3 = CKD; G4 = CKD + iPS‐MSCSPIONs (0.5 × 10⁶ cells); G5 = CKD + iPS‐MSCSPIONs (1.0 × 10⁶ cells). CKD, chronic kidney disease; iPS‐MSC, induced pluripotent stem cells‐derived mesenchymal stem cells; iPS‐MSCSPIONs, the iPS‐MSC was labelled by paramagnetic contrast agent