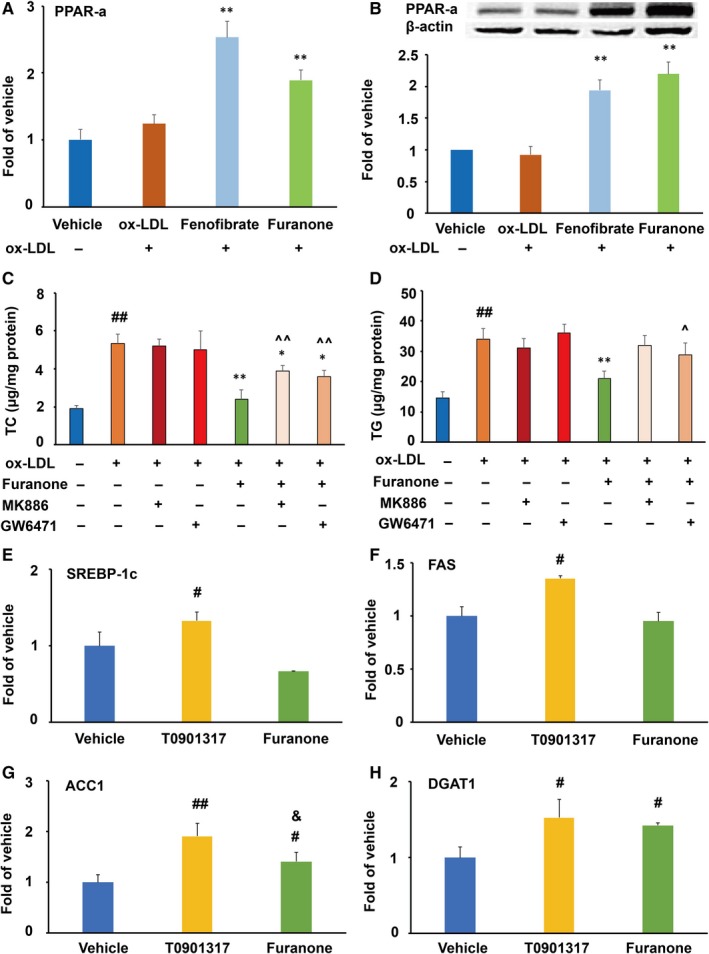
Figure 6.

Effect of furanone on the expression of PPARα and TG synthesis‐related genes in RAW264.7 cells (n = 4). (A) mRNA expression of PPARα; (B) protein expression of PPARα densitometric quantification; (C) effect of PPARα antagonists on furanone‐induced TC lowering; (D) effect of PPARα antagonists on furanone‐induced TG lowering; (E) mRNA expression of SREBP‐1c; (F) mRNA expression of FAS; (G) mRNA expression of ACC1; H, mRNA expression of DGAT1. #means P < .05 vs vehicle; #means P < .05 vs vehicle; ##means P < .01 vs vehicle; *means P < .05 vs model group; **means P < .01 vs model group; ^means P < .05 vs furanone treatment alone; ^^means P < .01 vs antagonist treatment alone; &means P < .05 vs T0901317
