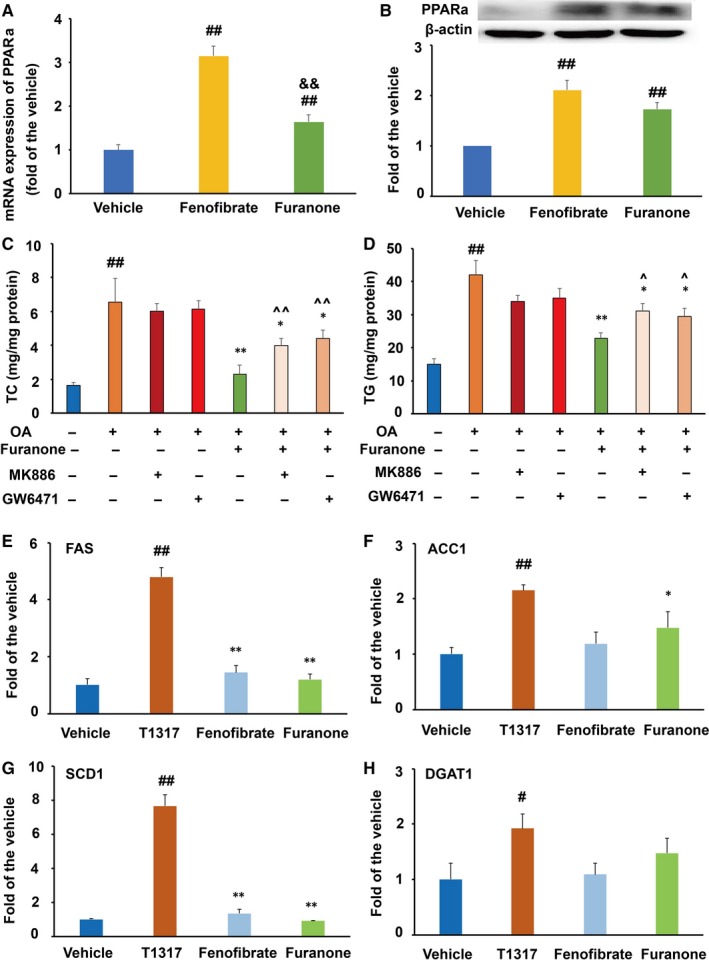
Figure 10.

This furanone lowered lipids by enhancing PPARα in HepG2 cells. (A) mRNA expression of PPARα; (B) protein expression of PPARα and densitometric quantification; (C) PPARα antagonists reduced the TC‐lowering effect of the furanone; (D) PPARα antagonists significantly reduced the TG‐lowering effect of the furanone; (E) mRNA expression of FAS; (F) mRNA expression of ACC1; (G) mRNA expression of SCD1; H, mRNA expression of DGAT1. Data are expressed as mean ± SD (n = 3). #means P < .05 vs vehicle; ##means P < .01 vs vehicle; &&means P < .01 vs fenofibrate. In Fig. C and D, *means P < .05 vs OA alone; **means P < .01 vs OA alone; ^means P < .05 vs furanone (without antagonist) group; ^^means P < .01 vs furanone (without antagonist) group. In Fig. E‐H, *means P < .05 vs T0901317; **means P < .01 vs T0901317
