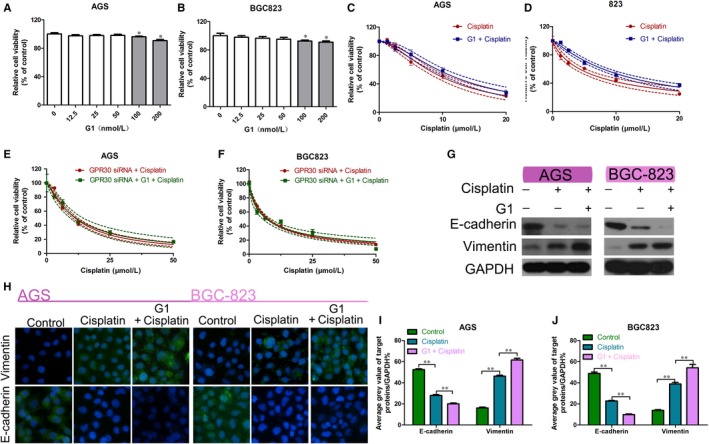
Figure 5.

Effect of G1 activation of GPR30 on GC cells. A,B, Viability of the AGS and BGC‐823 cells treated with various concentrations of G1 for 48 h, as measured using the CCK‐8 assay. *P < .05. C,D, Viability of the AGS and BGC‐823 cells treated with cisplatin alone or in combination with G1 for 48 h, as measured using the CCK‐8 assay. E,F, Viability of the AGS and BGC‐823 cells transfected with GPR30 siRNA after treatment with cisplatin alone or in combination with G1 for 48 h, as measured using the CCK‐8 assay. G, Western blot analysis of E‐cadherin and vimentin in AGS and BGC‐823 cells treated with cisplatin alone or in combination with G1 for 48 h compared with the control. H‐J, EdU staining assays of AGS and BGC‐823 cells treated with cisplatin alone or in combination with G1 for 48 h. **P < .01
