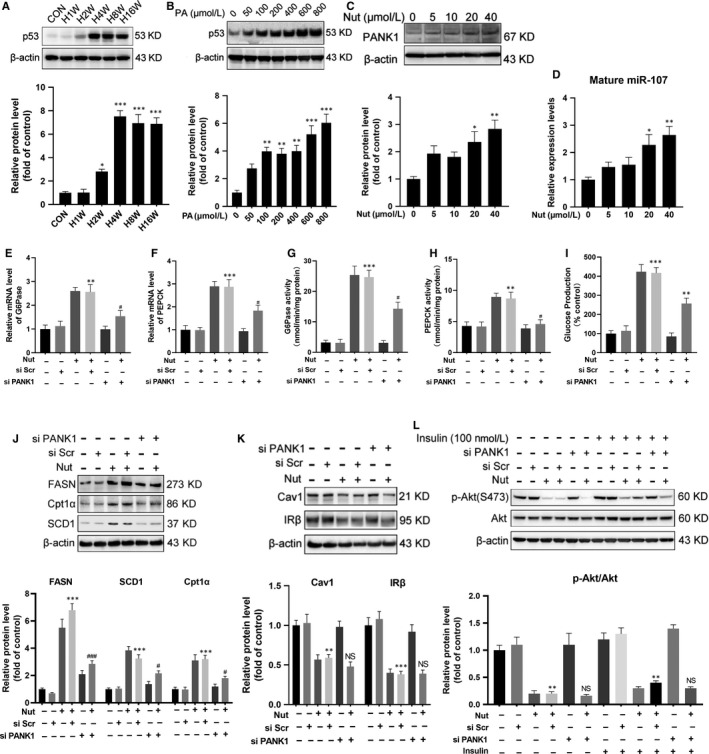
Figure 5.

Activation of P53 induced metabolic reprogramming through transcriptional activation of PANK1. A, The mice were fed on HFD, and the protein level of P53 in the liver tissue was measured by Western blotting at 1st, 2nd, 4th, 8th and 16th week of HFD feeding (n = 6). B, The AML12 cells were treated with 0, 50, 100, 200, 400, 600 and 800 μmol/L palmitate acid (PA) for 24 h, and the protein level of P53 was measured by Western blotting. C: The AML12 cells were treated with 0, 5, 10, 20 and 40 μmol/L Nutlin‐3a (Nut) for 24 h, and the protein level of PANK1 was measured by Western blotting. D, The level of mature miR‐107 in AML12 cells was measured by real‐time RT‐PCR. E and F, The AML12 cells were treated with scrambled small interfering RNA (si Scr) or PANK1 small interfering RNA (si PANK1). After 24 h, the cells were treated with Nutlin‐3a (20 μmol/L, Nut) for 24 h. The mRNA levels of G6Pase and PEPCK in AML12 cells were measured. G and H, The activity of G6Pase and PEPCK in AML12 cells was measured. I: Glucose production measured in AML12 cells. J and K, The protein levels of FASN, SCD1, Cpt1α, Cav1 and IRβ were measured by Western blotting. L, Before harvest, cells were stimulated with 100 nmol/L insulin for 20 min and protein expressions of p‐Akt (S473) and Akt were measured. All values are presented as mean ± SEM. Data in A‐D, *P < .01, **P < .01, ***P < .001 (vs CON). Data in E‐L, **P < .01, ***P < .001 (vs si Scr); # P < .05, ## P < .01, ### P < .001 (vs Nut + si Scr). n = 3 independent experiments
