Figure 6.

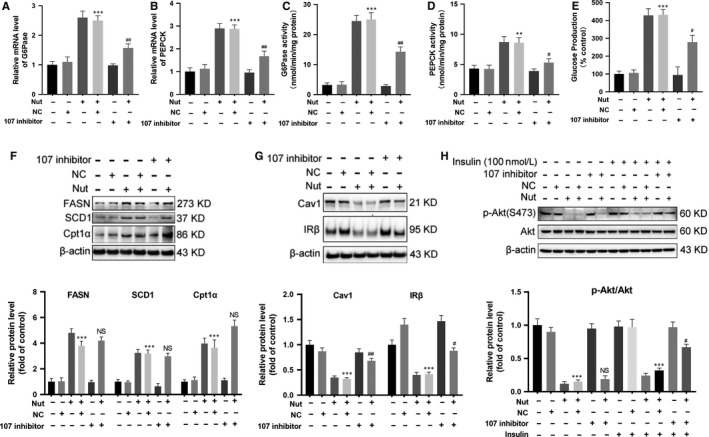
Activation of P53 induced insulin resistance through transcriptional activation of miR‐107. The AML12 cells were treated with negative control (NC) or miR‐107 inhibitor in the presence of Nutlin‐3a (20 μmol/L, Nut) for 24 h. A and B, The mRNA levels of G6Pase and PEPCK in AML12 cells were measured. C and D, The activity of G6Pase and PEPCK in AML12 cells was measured. E, Glucose production measured in AML12 cells. F and G, The protein levels of FASN, SCD1, Cpt1α, Cav1 and IRβ in AML12 cells were measured by Western blotting. H, Before harvest, cells were stimulated with 100 nmol/L insulin for 20 min and protein expressions of p‐Akt (S473) and Akt were measured. All values are presented as mean ± SEM. **P < .01, ***P < .001 (vs NC); # P < .05, ## P < .01, ## P < .01 (vs Nut + NC). n = 3 independent experiments
