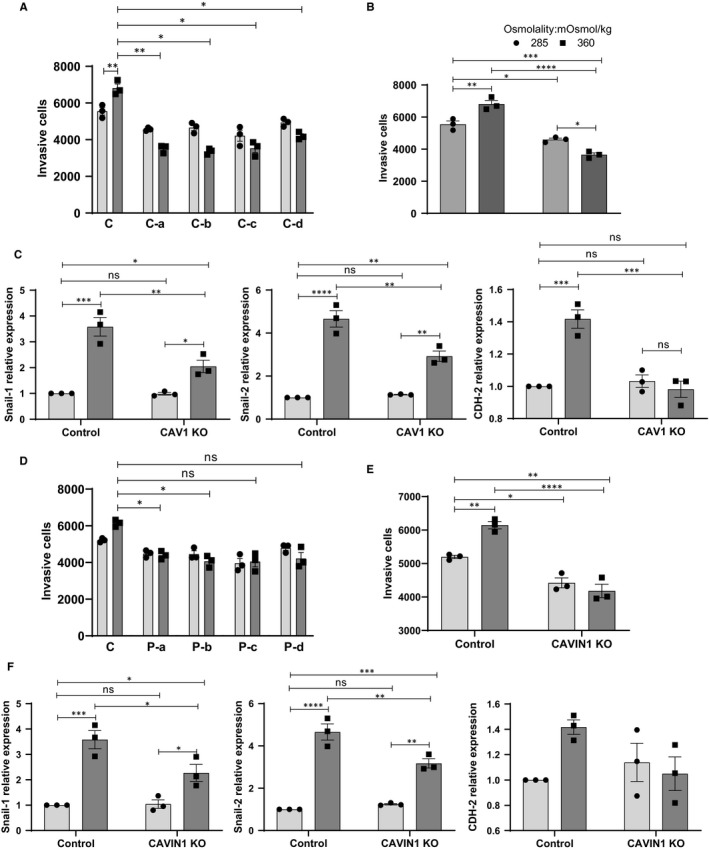
Figure 6.

Effect of osmotic pressure on CAV1 or CAVIN1 CRISPR‐Cas9 KO U251 cells in vitro invasion potential. (A) Determination of basement membrane cell invasion of control or four individual CAV1 KO pool in 285 or 360 mOSmol/kg media. (B) Quantification of CAV1 KO cell invasion shown as the average of n = 4 independent CAV1 KO cell pools. (C) mRNA expression of EMT markers in CAV1 KO cells after 48 h of osmotic stress. (D) Determination of basement membrane cell invasion of control or four individual CAVIN1 KO cell pools in 285 or 360 mOSmol/kg media. (E) Quantification of CAVIN1 KO cell invasion shown as the average of n = 4 independent CAVIN1 KO cell pools. (F) mRNA expression of EMT markers in CAVIN1 KO cells after 48 h of osmotic stress. All results are expressed as mean ± SEM of n = 3 independent experiments. Results were analysed by one‐way ANOVA with Dunnett's multiple comparisons test (A, D) or two‐way ANOVA with Tukey's multiple comparisons test (B, C, E, F). *P < .05, **P < .01, ***P < .001, ****P < .0001
