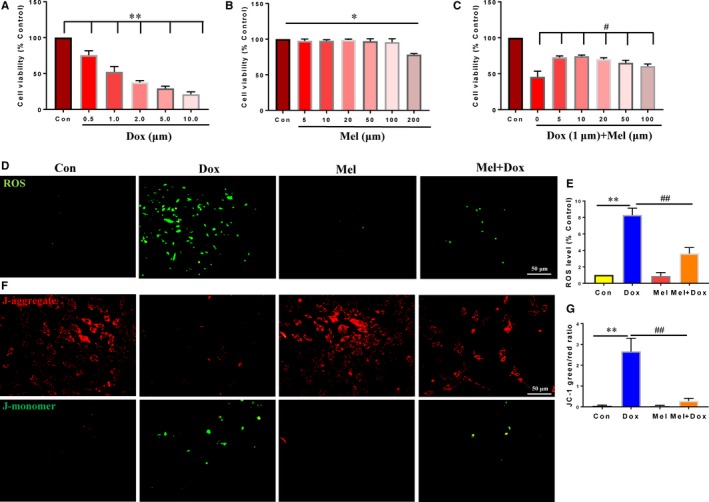
Figure 1.

Mel treatment reversed the effects of Dox on H9c2 cells. Cell viability in control, as well as differing doses of doxorubicin (Dox, A), melatonin (Mel, B) and co‐treated Mel with Dox (C) in H9c2 cells. (D‐E): Representative fluorescent images of DCFH‐DA loading (D) and quantification of intracellular reactive oxidative species (ROS) levels in control, Dox, Mel and Mel+Dox treated H9c2 cells. Representative JC‐1 images (F) and quantification of JC‐1 green/red fluorescent ratio in the 4 groups of treated cells. n = 3 independent experiments/group. *P < .05 compared with the control group, **P < .01 compared with the control group, # P < .05 compared with the Dox‐treated group, ## P < .05 compared with the Dox‐treated group
