Figure 2.

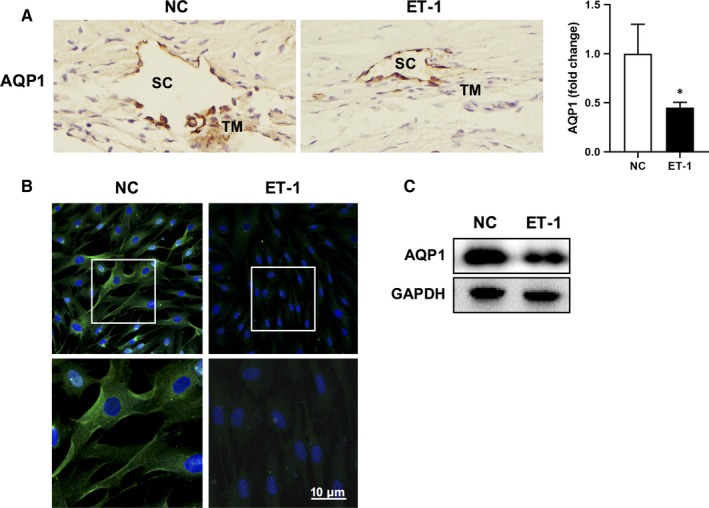
AQP1 level is attenuated in ET‐1‐induced POAG models. A, Representative immunohistochemistry for AQP1 in sections of rabbit trabecular meshwork tissues. TM, trabecular meshwork; SC, Schlemm's canal. B, Representative immunofluorescence staining for AQP1 (green, AQP1; blue, DAPI; scale bar, 10 μm) in HTMCs treated with ET‐1 or PBS, respectively. Bottom panels are high‐power magnification of the areas indicated by the boxes. C, Protein of AQP1 in HTMCs exposed to PBS or ET‐1 (100 nmol/L) for 24 h was determined by Western blot analysis. The cultured HTMCs are from one human donor
