Figure 5.

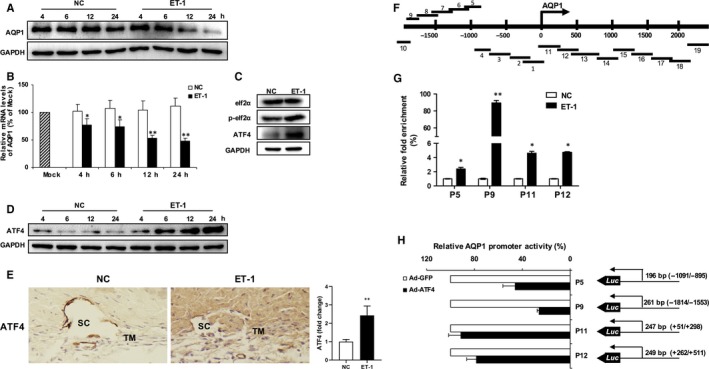
AQP1 transcription is negatively regulated by ATF4 upon ET‐1 stimulation. Protein or mRNA expression of AQP1 in HTMCs exposed to PBS or ET‐1 (100 nmol/L) for the respective 4, 6, 12 or 24 h was determined by Western blot analysis (A, the upper panel) or quantitative real‐time PCR, respectively (B, the lower panel). C, Western blot analysis for eIF2α, p‐eIF2α and ATF4 in PBS or ET‐1 (100 nmol/L, 24 h) treated HTMCs. D, Protein level of ATF4 in HTMCs exposed to PBS or ET‐1 (100 nmol/L) for the respective 4, 6, 12 or 24 h was determined by Western blot analysis. E, Representative immunohistochemistry for ATF4 in sections of rabbit trabecular meshwork tissues. TM, trabecular meshwork; SC, Schlemm's canal. F, Schematic of fragments map of AQP1 transcription start site (−2000 to +2500). G, Relative fold enrichment of ATF4 binding region of AQP1 promoter by CHIP‐QPCR on HTMCs. Immunoprecipitated DNA was presented as percentage of total DNA input and expressed as fold changes in HTMCs treated with ET‐1 relative to PBS control. H, HTMCs were cotransfected with AQP1‐Luc reporter plasmid containing the respective AQP1 promoter region (AQP1‐P5, P9, P11 or P12) and ATF4 expression plasmids (Ad‐ATF4) for 72 h. Cells were subjected to dual‐luciferase reporter assay. Each value is shown as a percentage of the empty plasmid control (Ad‐GFP). The cultured HTMCs are from one human donor. Data are means ± SEM of three independent experiments. *P < .05 and **P < .01 vs control
