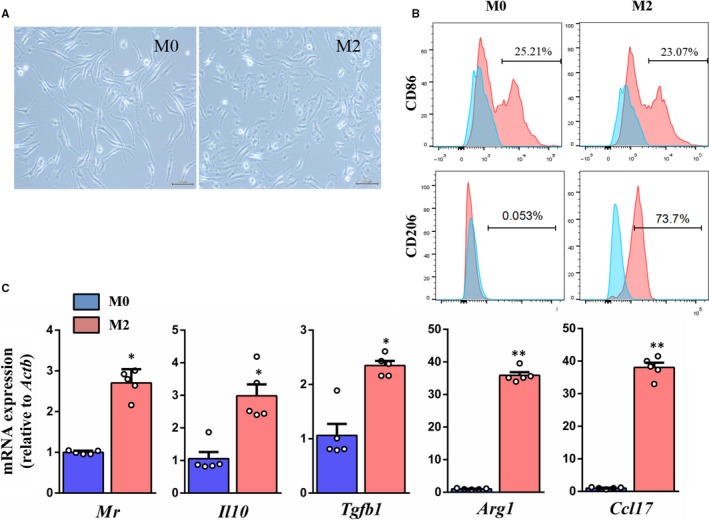
Figure 1.

Isolation and validation of mice peritoneal macrophages. A, Microscopic views of M0 and M2 macrophages (scale bar = 200 µm). B, Flow cytometric analysis of macrophage markers CD86 and CD206. C, Real‐time PCR analysis of M2 macrophages markers Mr, Il10, Tgfb1, Arg1 and Ccl17 at mRNA level. *P < .05, **P < .01 vs M0 (n = 5)
