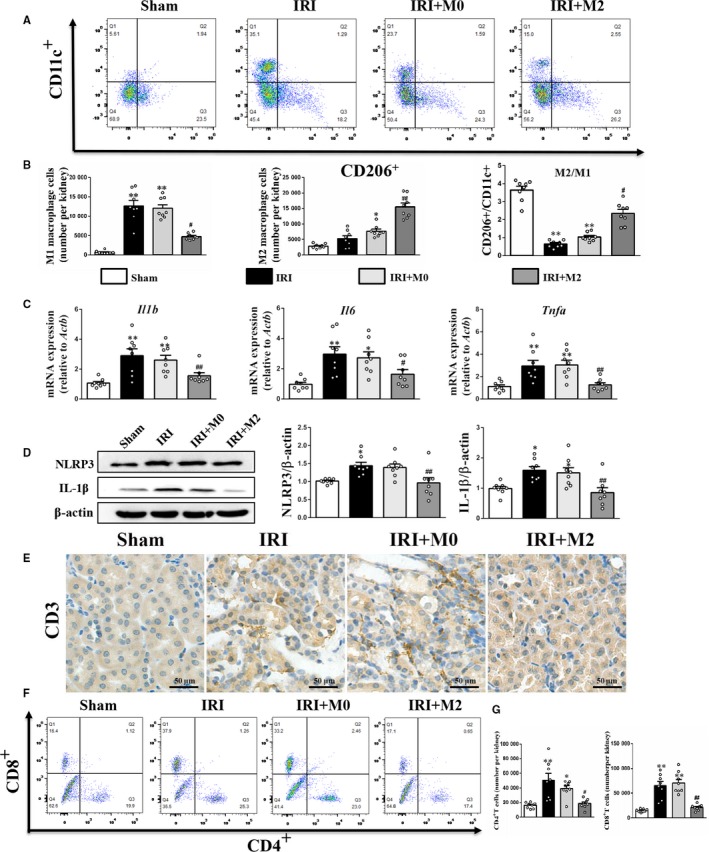
Figure 3.

M2 macrophages reduced inflammatory response in kidneys after IRI. A, Flow cytometry analysis of M2 and M1 macrophages in kidney at day 3 after IRI. B, The absolute number of M1 and M2 macrophages in mice per kidney tissue, and quantification analysis of M2/M1 ratio in kidney. C, Real‐time PCR analysis of Il1b, Il6 and Tnfα mRNA level at day 3 after IRI. D, Western blot analysis of NLRP3 and IL‐1β protein level at day 3 after IRI. E, IHC staining for CD3 at day 3 after IRI (Scale bar = 50 µm). F, Flow cytometry analysis of CD4 + and CD8 + T cells in kidney at day 3 after IRI. G, The absolute number of CD4 + and CD8 + T cells in mice per kidney tissue. *P < .05, **P < .01 vs Sham. #P < .05, ##P < .01 vs IRI (n = 8)
