
Figure 7.
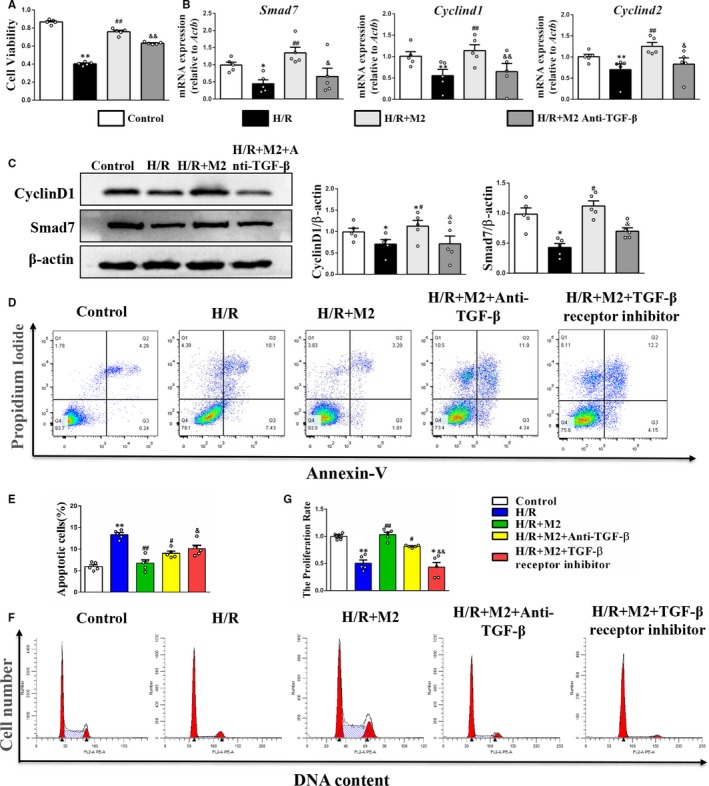
Effects of M2 macrophages on cell proliferation in PTECs under H/R. A, Cell viability was determined using the CCK‐8 assay. B, Real‐time PCR analysis of Smad7, Cyclind1 and Cyclind2 mRNA level. C, Western blot and quantification analysis of CyclinD1 and Smad7 protein level. D and E, The apoptotic ratios of PTECs were determined by flow cytometry. F and G, Cell proliferation rates were detected by flow cytometry. *P < .05, **P < .01 vs Control. #P < .05, ##P < .01 vs H/R. &P < .05, &&P < .01 vs H/R + M2 (n = 5)