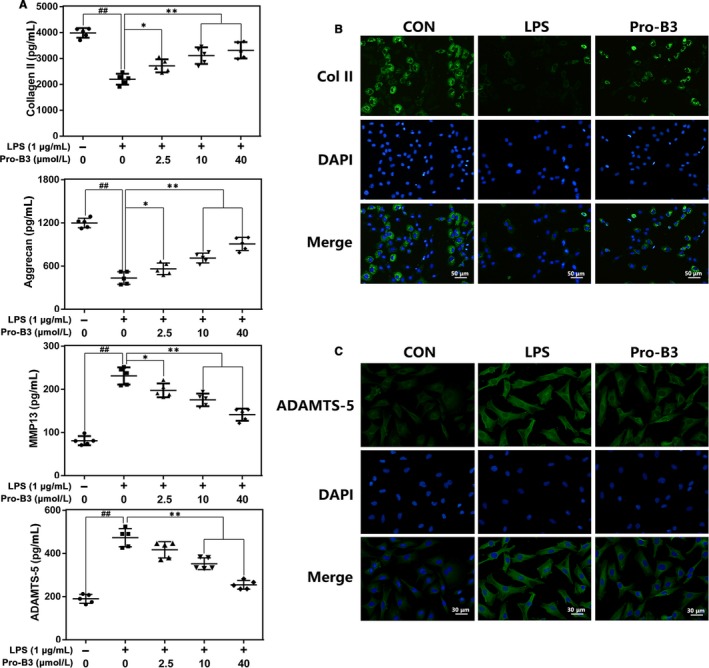
Figure 3.

Influence of Pro‐B3 in LPS‐medicated ECM degeneration in human NP cells. A, The level of Collagen II, aggrecan, MMP13 and ADAMTS‐5 in NP cells treated as above were visualized by ELISA. B and C, The representative collagen II and ADAMTS‐5 were detected by the immunofluorescence combined with DAPI staining for nuclei (scale bar: 50 or 30 µm). The data in the figures represent the averages ± SD Significant differences among different groups are indicated as ## P < .01, vs control group; *P < .05 and **P < .01 vs LPS alone treatment group, n = 5
