
FIGURE 1.
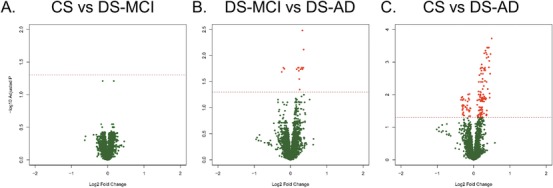
Differentially expressed metabolite features. Volcano plots showing differential expression (DE) of individual features for each of the three comparisons: cognitively unaffected and stable (CS) versus Down syndrome‐mild cognitive impairment (DS‐MCI; A), DS‐MCI versus Down syndrome‐Alzheimer's disease (DS‐AD; B), and CS versus DS‐AD (C). We enforced false discovery rate (FDR) q < 0.05, but no fold change criterion for DE. There were no DE features for the CS versus DS‐MCI comparison, 17 DE features for the DS‐MCI versus DS‐AD comparison, and 163 DE features for the CS versus DS‐AD comparison. The red horizontal line represents the cut‐off for FDR and red circles represent DE features in each plot