
FIGURE 2.
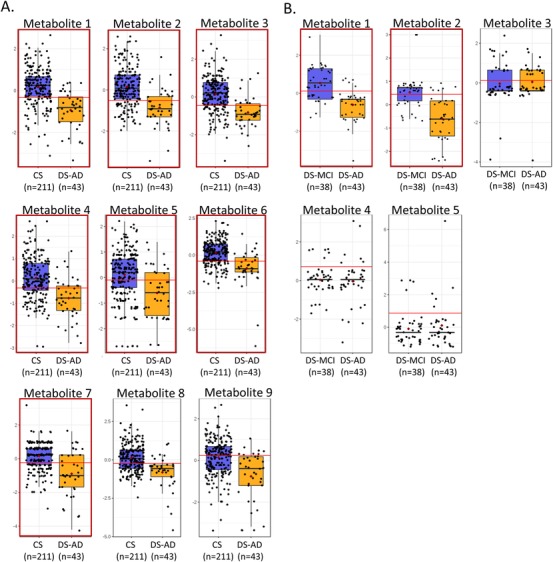
Features selected by the machine learning algorithms. This figure shows the group distributions of the nine features selected by the least absolute shrinkage selection operator (LASSO) feature selection algorithm for the cognitively unaffected and stable (CS) versus Down syndrome‐Alzheimer's disease (DS‐AD) comparison (A) and the five features selected by the support vector machine (SVM) for the Down syndrome‐mild cognitive impairment (DS‐MCI) versus DS‐AD comparison. The boxplots show the distribution of metabolite abundances for each group with each participant represented as a solid circle. The solid line in each box represents the median while the lower and upper boundaries of the box reflect the first and third quartiles. The whiskers reflect the minimum and maximum values. The horizontal red line in each panel represents the optimum cut‐off for sensitivity and specificity in a univariate receiver operating characteristic area under the curve (ROC AUC). Panels with red outlines are the metabolites definitively identified by MS/MS and are listed by name in Table 2. Panels without red outlines could not be definitively identified by MS/MS