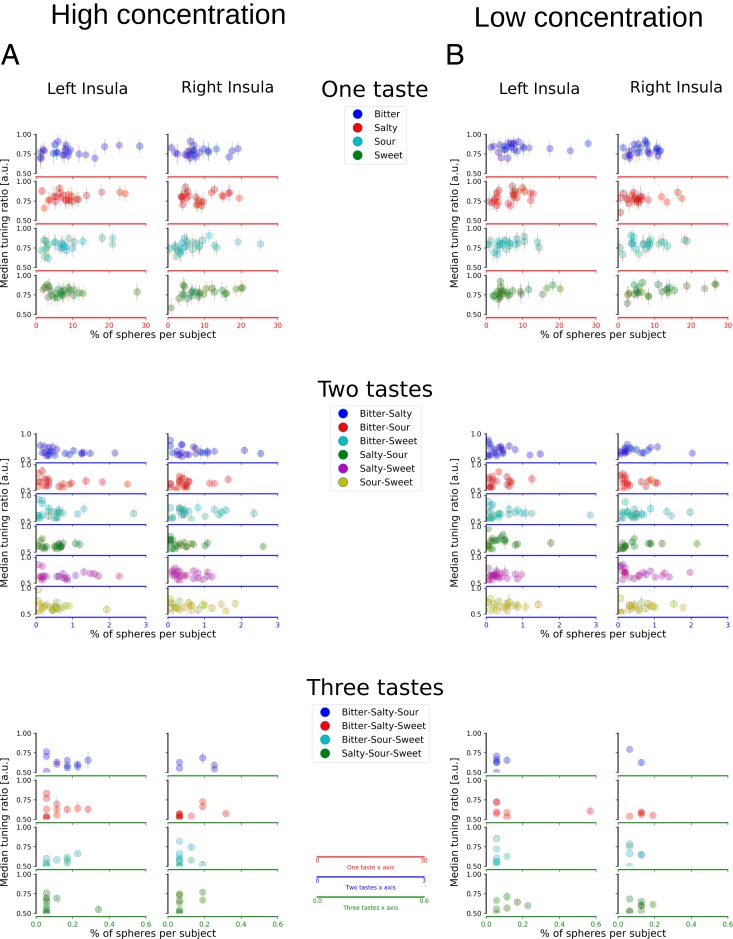
Fig. 2.
Subject-specific TIs. Scatter plots depict median TIs for all subjects (each dot represents a subject) separately for high (A) and low (B) concentrations in insular cortex (see SI Appendix, Figs. S2 and S3 for gustatory ROIs). The y axis represents the median TIs for a specific taste or a compound of tastes. A TI of 0.75 indicates that the ER for the preferred taste was three times higher than the second-highest ER (see Methods for further details). The x axis indicates the percentage of spheres which show a preferential tuning for a taste or a compound of tastes. Scatter plots, from top to bottom, represent percentage of spheres tuned to single tastes (two top columns), double tastes (two middle columns), and triple tastes (two bottom columns); the left and right columns of each taste configuration represent the left and right insula, respectively. Note that the x axis is scaled differently for single-, double- and triple-taste spheres (top, middle, and bottom columns) due to the decreasing number of spheres responsive to double- and triple-taste compounds.

