Fig. 1.
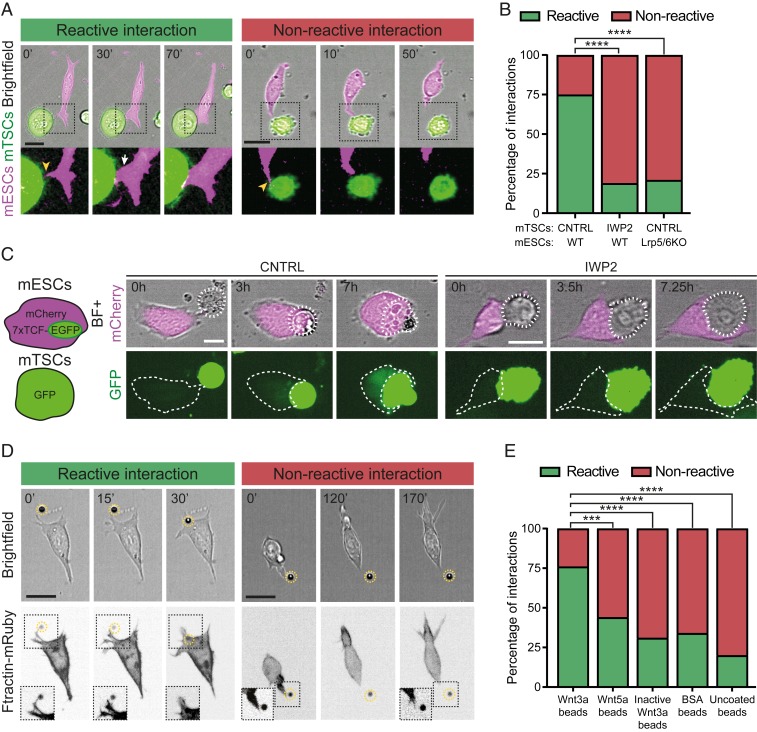
ESCs selectively react to self-renewal–promoting Wnt signals and initiate pairing with TSCs. (A) Representative frames from time-lapse imaging of ESCs (expressing Ftractin-mRuby3; magenta) interacting with TSCs that express eGFP (green). Examples of reactive interactions (Left, green) and nonreactive interactions (Right, red) are shown. (Scale bars, 20 μm.) Time is expressed in minutes. Arrowheads (yellow) indicate initial interaction through thin protrusions; the arrow (white) indicates larger protrusion. (B) Quantification of the percentage of reactive (green) and nonreactive (red) interactions between ESCs and TSCs in different conditions. n ≥ 44 from more than three independent experiments. (C) Schematic (Left) and representative images (Right) of ESCs expressing the 7xTCF-EGFP//simian virus 40 early promoter (SV40)-mCherry (a Wnt/β-catenin pathway reporter) and contacting TSCs. Shown are representative images of EGFP expression levels in ESCs contacting WT cells (CNTRL) or 24-h IWP2-pretreated TSCs. In both conditions, 100 ng/mL R-spondin was added to the media to increase pathway activation. Dashed white line marks TSCs (Top) and ESCs (Bottom). (Scale bars, 20 µm.) Time is expressed in hours. (D) Representative images from time-lapse imaging of ESCs expressing the F-actin reporter Ftractin-mRuby3 (Bottom, grayscale) and interacting with beads. Reactive (Left, green) and nonreactive (Right, red) interactions are shown. (Scale bars, 20 μm.) Time is expressed in minutes. Insets are magnified and contrast-enhanced for clarity. (E) Quantification of the percentage of reactive (green) and nonreactive (red) interactions between ESCs and different types of beads. n ≥ 41 cells from at least three independent experiments. Asterisks indicate statistical significance calculated by Fisher’s exact test: ***P < 0.001; ****P < 0.0001.

